SEISMOS – Interactive Earthquake Data Analytics & GIS Dashboard
تفاصيل العمل
Project Overview
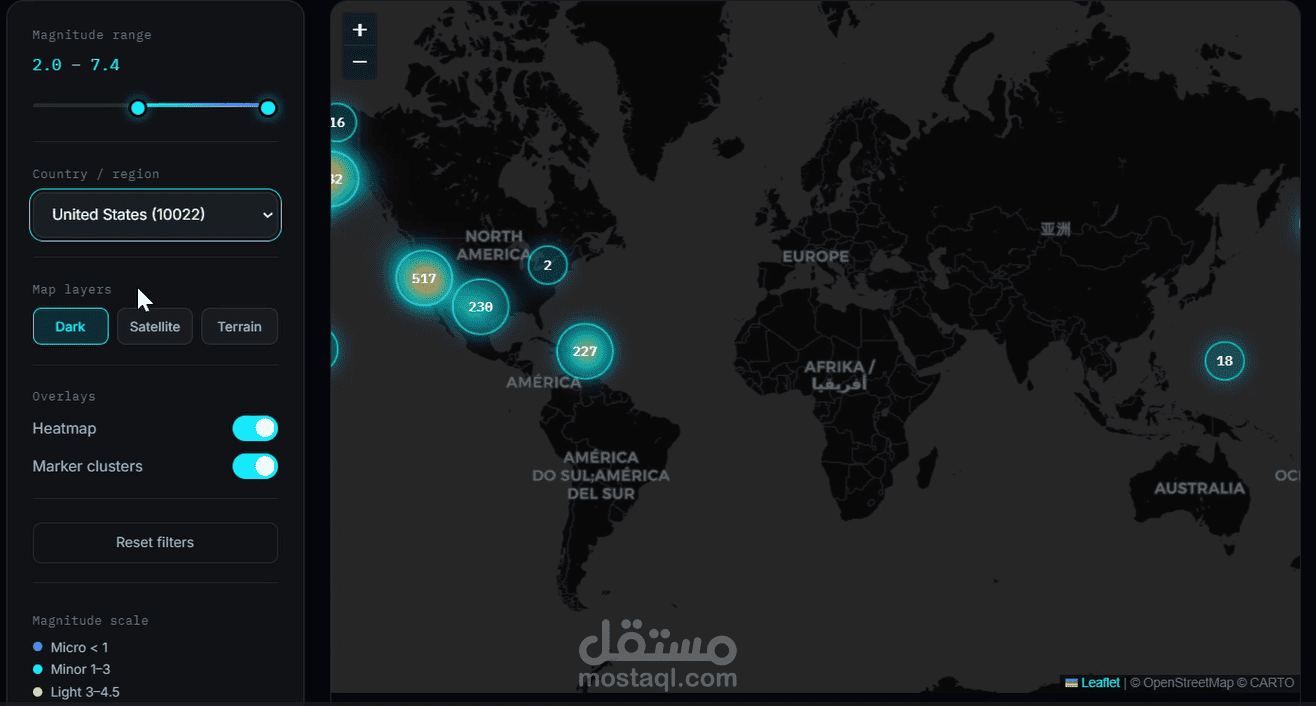
SEISMOS is an interactive earthquake intelligence dashboard designed to explore and visualize global seismic activity through data analytics and geographic visualization.
Key Features
* Interactive global earthquake map.
* Visualization of earthquake locations and magnitudes.
* Statistical indicators, including total events, strongest magnitude, and average magnitude.
* Geographic filtering by country or region.
* Multiple map layers for exploring seismic activity.
* Interactive data visualization to support exploration of earthquake patterns.
Technologies Used
HTML, CSS, JavaScript, JSON, and GIS mapping technologies.
Project Objective
The goal of this project is to transform seismic data into an accessible and interactive visual experience, making it easier to explore earthquake activity and understand geographic patterns.
This project demonstrates practical work in data visualization, interactive dashboards, and geospatial data presentation.