Interactive Financial Stability Dashboard — Jordan Banking Sector (Web-Based, Real Data)
تفاصيل العمل
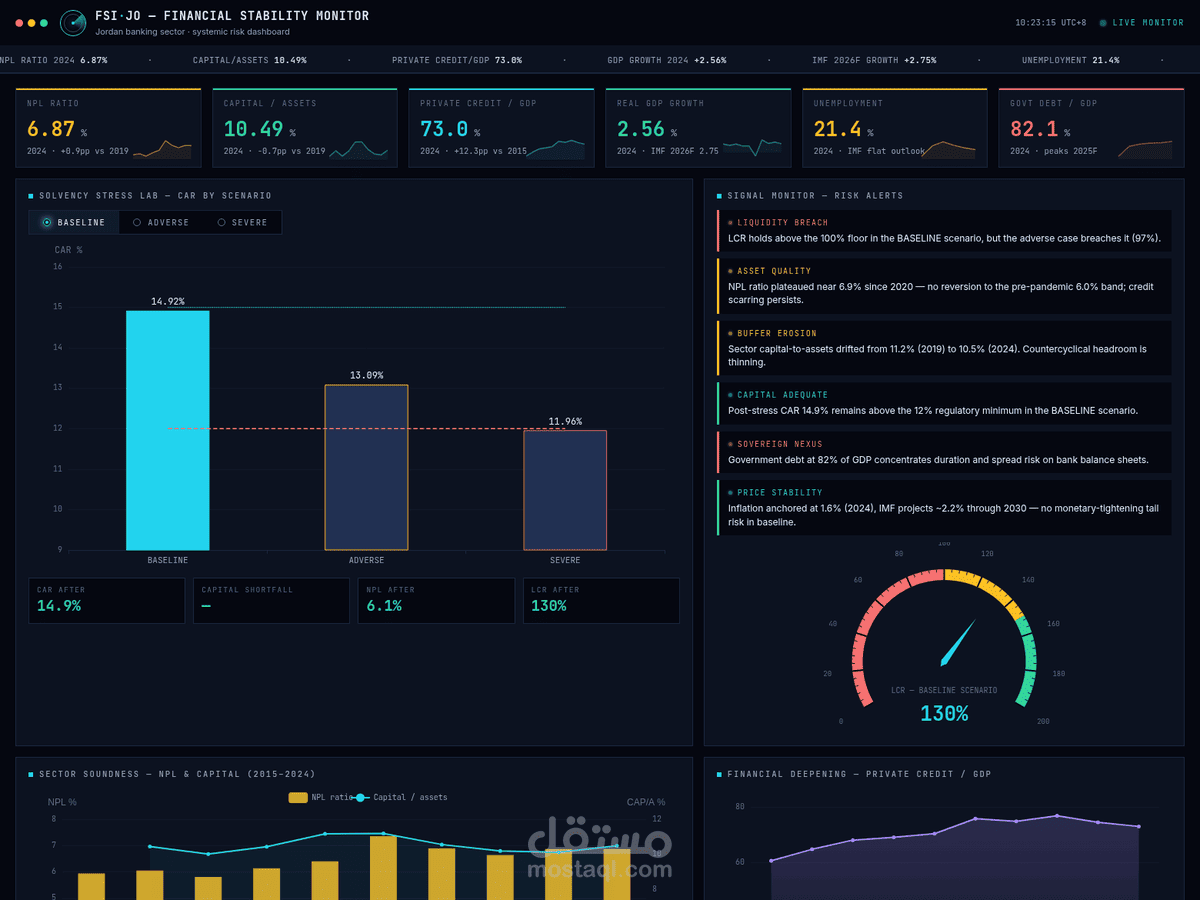
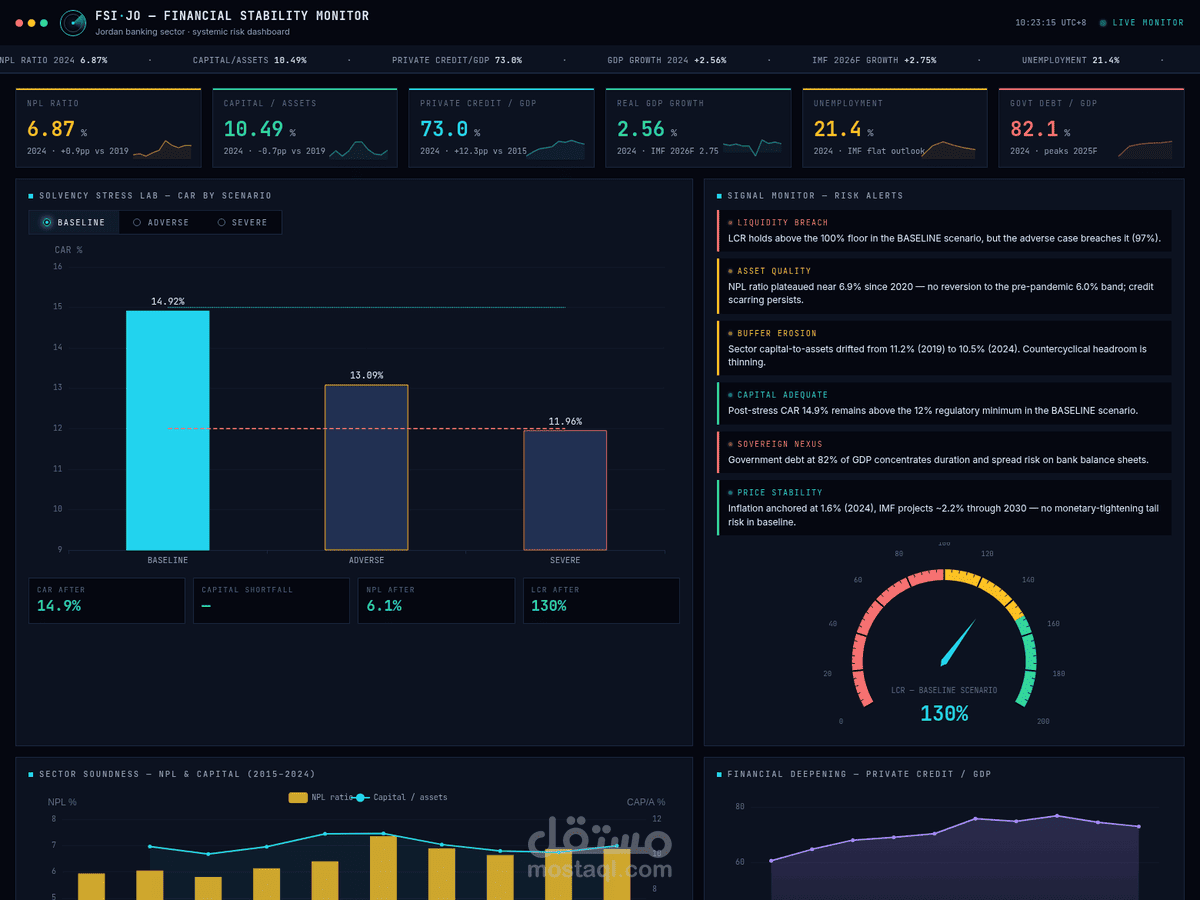
A live, terminal-grade financial stability monitoring dashboard for the Jordanian banking sector, built end-to-end with JavaScript and Apache ECharts.
Key features: - Six headline KPI tiles with trend sparklines: NPL ratio, capital-to-assets, private credit/GDP, real GDP growth, unemployment, government debt/GDP - An interactive Solvency Stress Lab: switch between Baseline / Adverse / Severe scenarios and watch capital adequacy (CAR), capital shortfall, post-stress NPL and liquidity coverage (LCR) recompute instantly through a Basel III-aligned stress engine - A signal monitor with color-coded risk alerts (liquidity breach, asset quality, buffer erosion, sovereign nexus) - A capital depletion heatmap (NPL shock × LGD) mapping the full solvency surface - IMF WEO forecast overlays (GDP growth, government debt path to 2030)
All macro and banking data are real, sourced from World Bank Open Data and the IMF World Economic Outlook. The stress engine mirrors the accompanying Excel model (see Work 2).
Tools: JavaScript · Apache ECharts · CSS · World Bank / IMF data APIs