Excutive overview
تفاصيل العمل
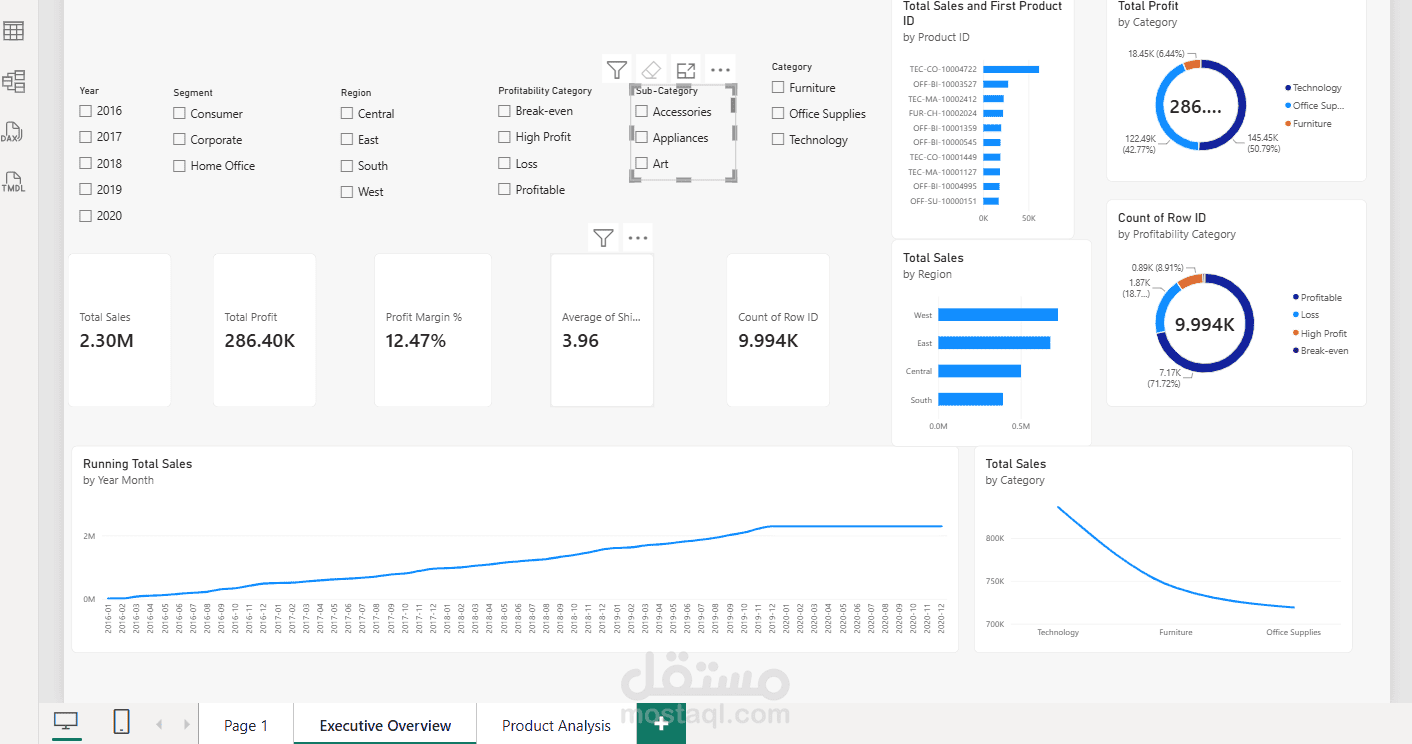
Interactive Power BI Dashboard – Retail Sales Executive Overview
Behind every business decision, there should be a clear picture — and that's exactly what this dashboard was built for. I took three years of raw retail sales data (9,994 orders) and transformed it into an interactive Power BI dashboard any executive can read at a glance: KPI cards tracking $2.30M in sales and a 12.47% profit margin, a running trend line across 2017–2019, and slicers that let you slice the story by year, region, or category. The result? Numbers that finally speak.