project spotify
تفاصيل العمل
Project Description
Spotify Music & User Behavior Analysis Dashboard – Power BI
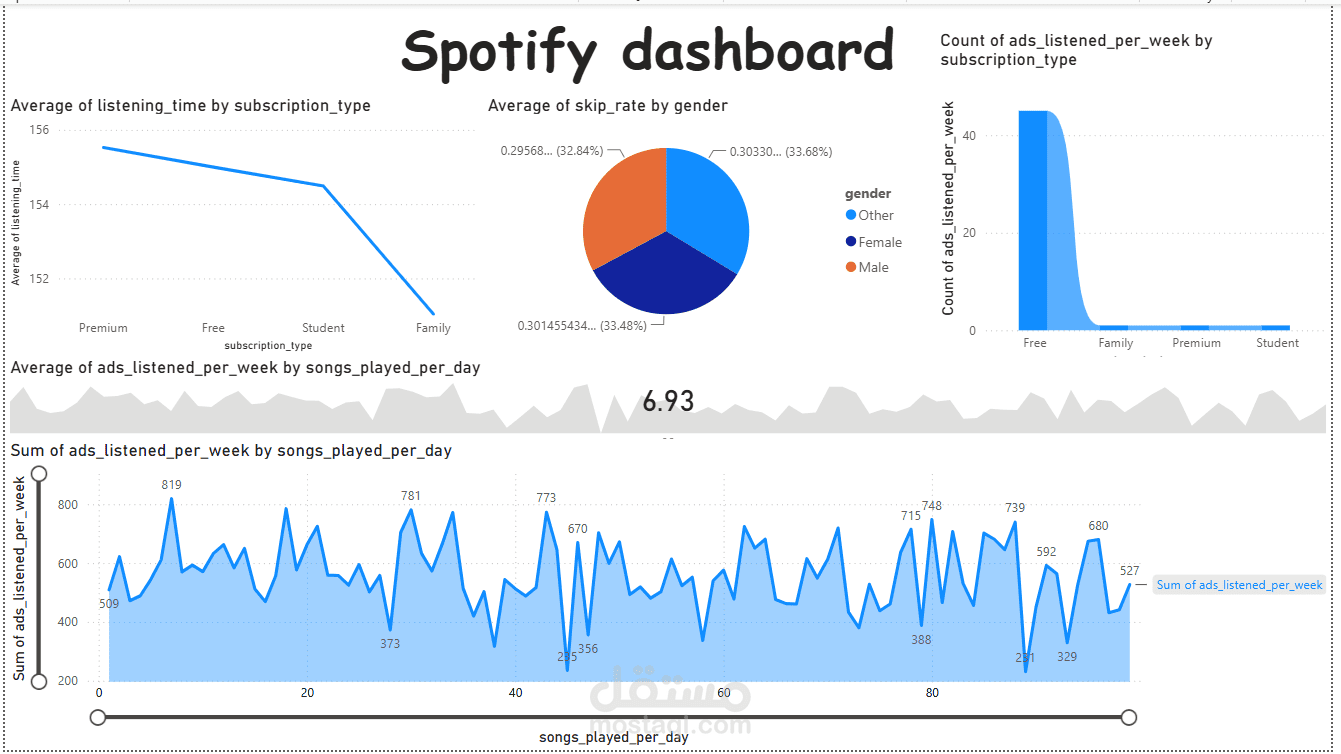
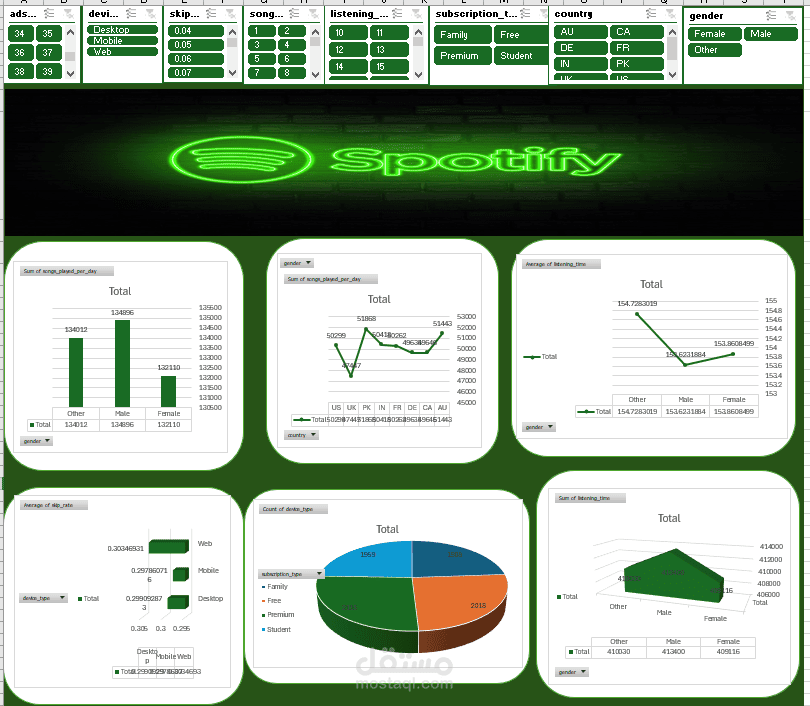
I developed an interactive Power BI dashboard to analyze Spotify user behavior and listening patterns. The dashboard transforms raw music-streaming data into clear and interactive visual insights.
Key Features:
Analyzed average listening time by subscription type
Compared skip rates by gender
Analyzed advertisements listened to per week by subscription type
Examined the relationship between songs played per day and ads listened to
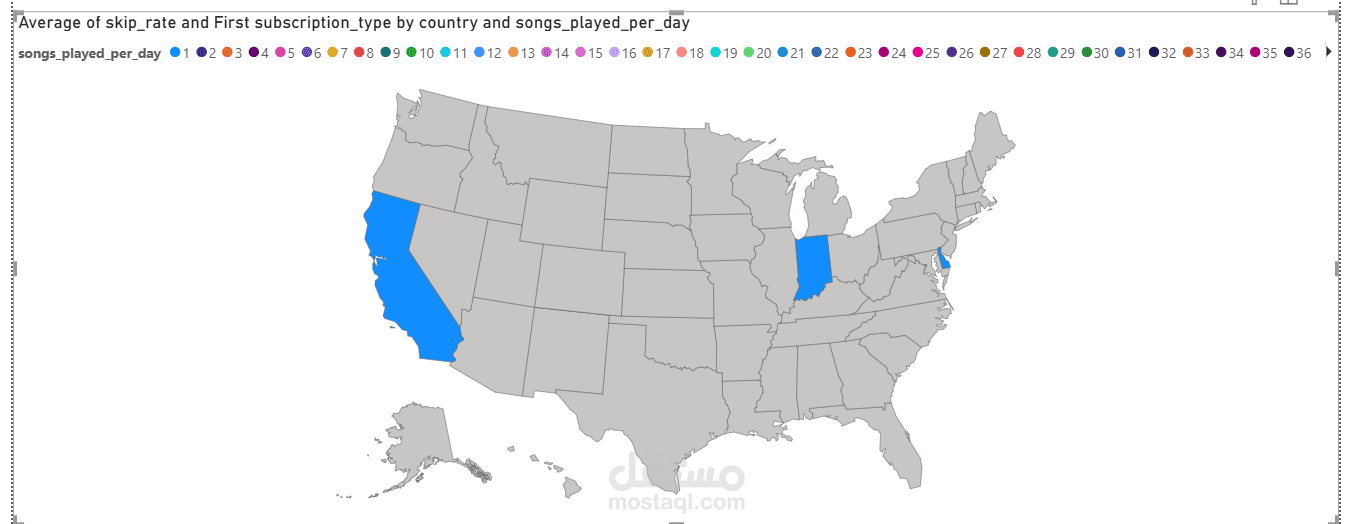
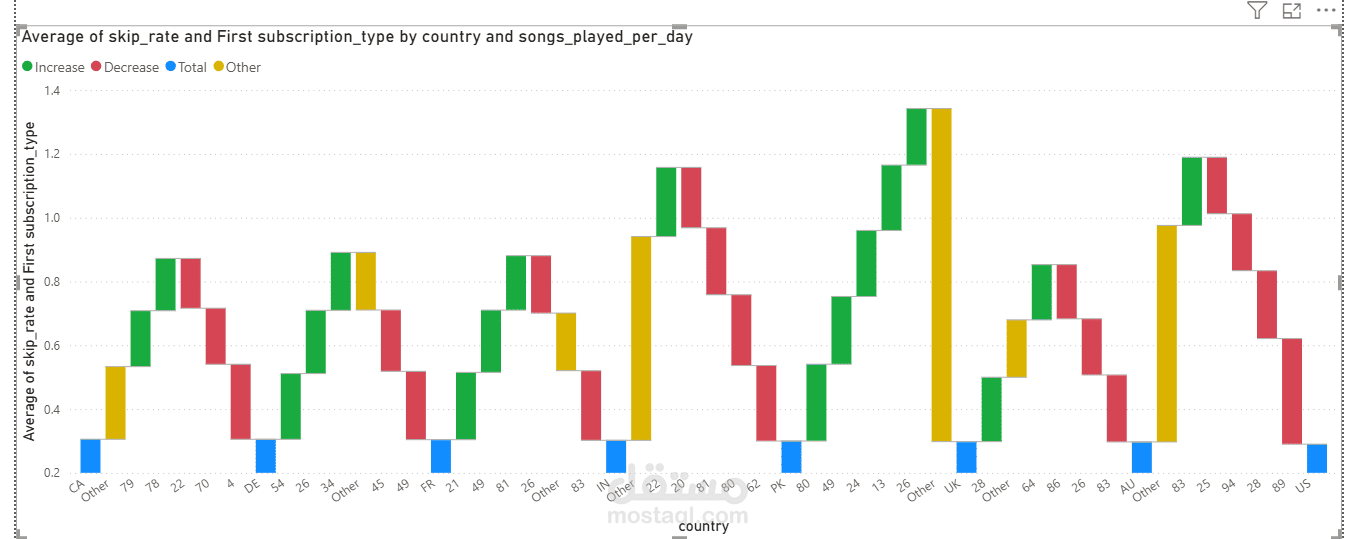
Created interactive charts to identify listening and user behavior patterns
Designed a clean and easy-to-understand dashboard for data-driven analysis
Tools & Skills:
Power BI | Data Analysis | Data Visualization | Excel | Dashboard Design
Project Goal:
Turn raw Spotify user data into an interactive dashboard that helps identify listening habits, subscription behavior, and user engagement patterns.