BMW Global Sales 2018–2025 Form Kaggle
تفاصيل العمل
? BMW Global Sales Dashboard (Power BI)
I developed an interactive Power BI dashboard to analyze BMW global sales data (2018–2025), transforming raw data into clear, actionable insights across regions, models, and time periods.
This project demonstrates my ability to clean data, build data models, and design dashboards that support business decision-making.
? Project Overview
Using a public dataset from Kaggle, I built a complete reporting solution to track sales performance, identify trends, and highlight key business drivers — including the growth of electric vehicles.
? Objectives
• Analyze revenue and sales performance across global regions
• Identify top-performing car models
• Track sales and pricing trends over time
• Detect seasonal patterns in sales
• Monitor the growth of electric vehicle adoption
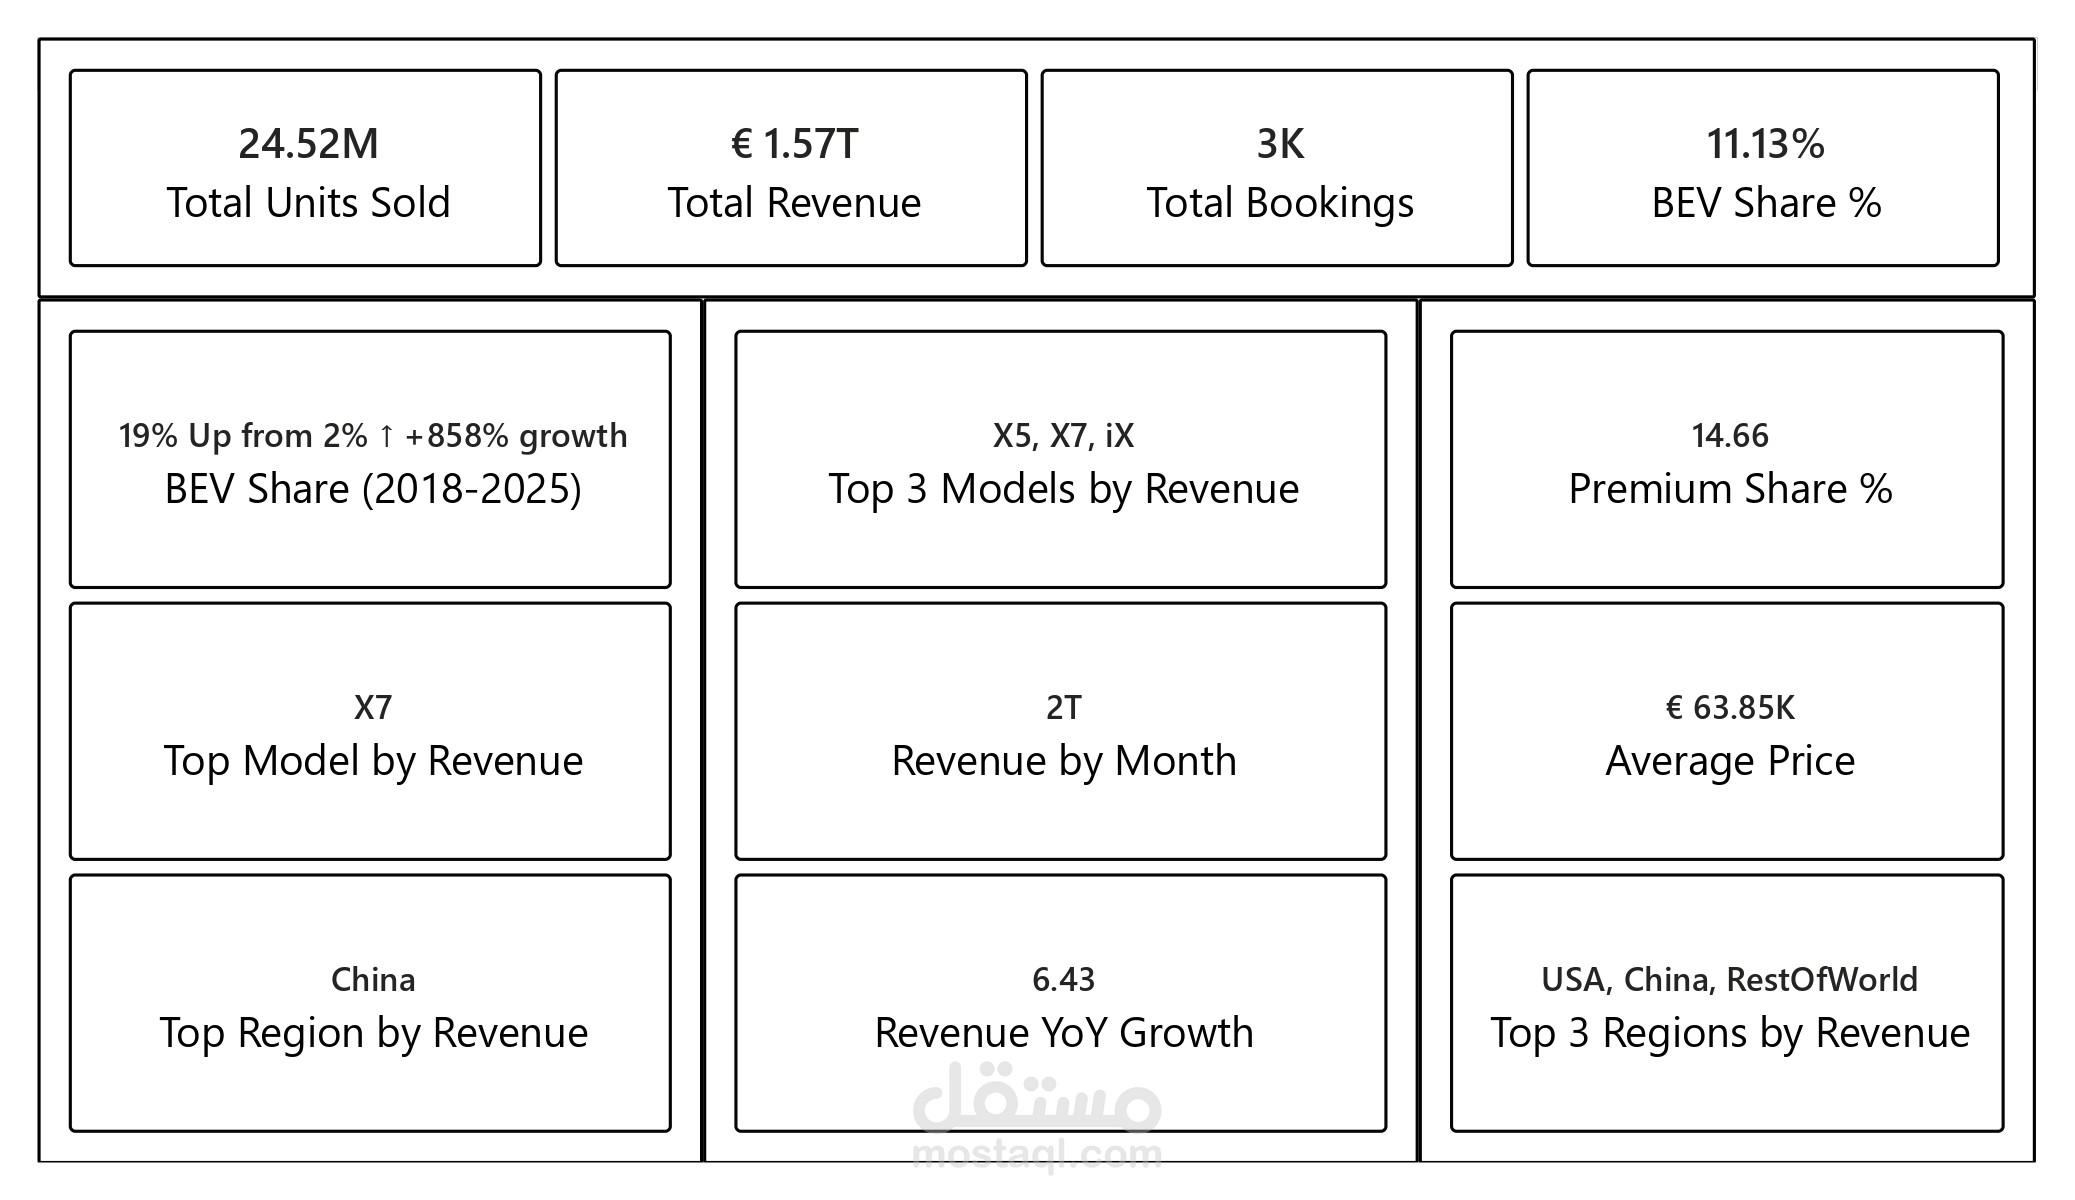
? Key Dashboard Insights
• Regional Performance
– Revenue, units sold, and average vehicle price by region
• Model Performance
– Revenue, sales volume, and pricing analysis per model
• Time-Based Trends
– Yearly revenue growth and sales trends
– Monthly performance and seasonality patterns
• Advanced Analysis
– Revenue comparison by model across months and years
– Regional performance trends over time
– Units sold analysis across different dimensions
? Tools & Techniques
Power BI | Power Query | Data Modeling | DAX | Data Cleaning | Interactive Dashboard Design
? Business Value
This dashboard simplifies complex data into a clear visual story, helping stakeholders quickly understand performance, identify opportunities, and make data-driven decisions.
It is designed for both technical and non-technical users, ensuring accessibility and usability.
---
If you need a custom dashboard, automated reporting, or data analysis tailored to your business, I can build a similar solution for you.