Performance Monitoring Dashboard – 2025
تفاصيل العمل
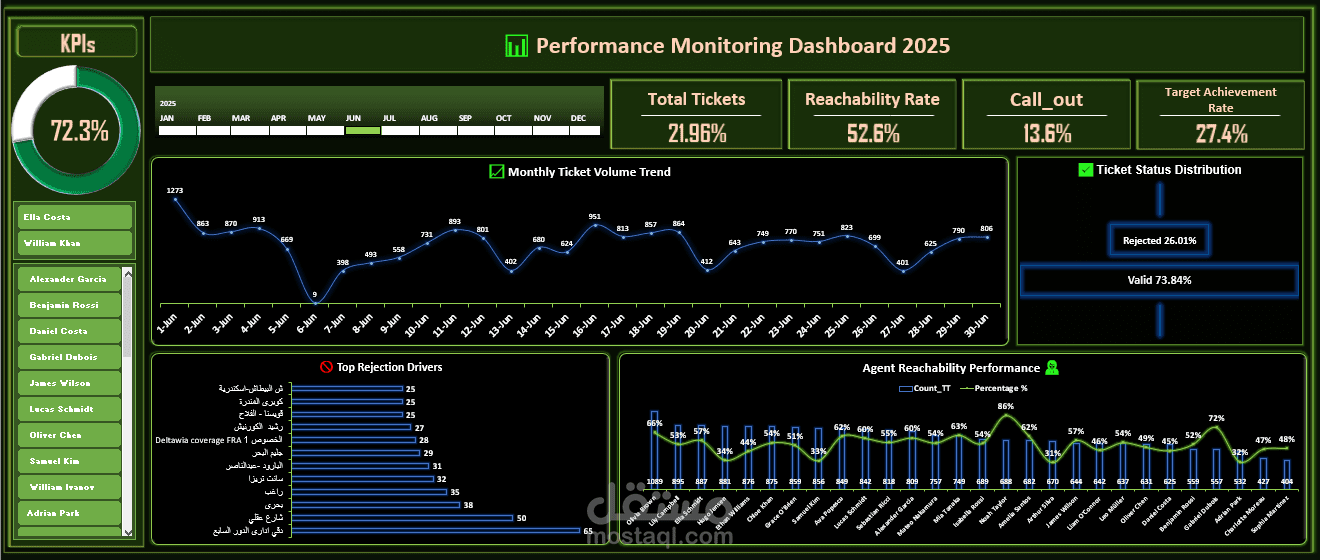
Objective
To monitor and evaluate service operations performance in 2025 by analyzing ticket validity,
agent reachability, rejection drivers, and KPI achievement to identify gaps and drive operational
improvements
Key Insights
Ticket Status: 73.84% Valid vs. 26.01% Rejected – significant rejection rate
Critical KPIs:
Overall Performance: 72.3%
Reachability Rate: 52.6% – below acceptable benchmark
Target Achievement Rate: Only 27.4% – severely underperforming
Call-out Rate: 13.6% – very low engagement
Top Rejection Drivers: Multiple issues showing 100% rejection rates (counts: 25–50 tickets),
including mixed Arabic/English entries indicating data quality issues
Agent Performance: Wide variation in reachability rates (60%–100%) – inconsistent
performance across team
Monthly Trend: Fluctuating ticket volume with peaks requiring better resource planning.