interval 30 MINs level workload forecasting
تفاصيل العمل

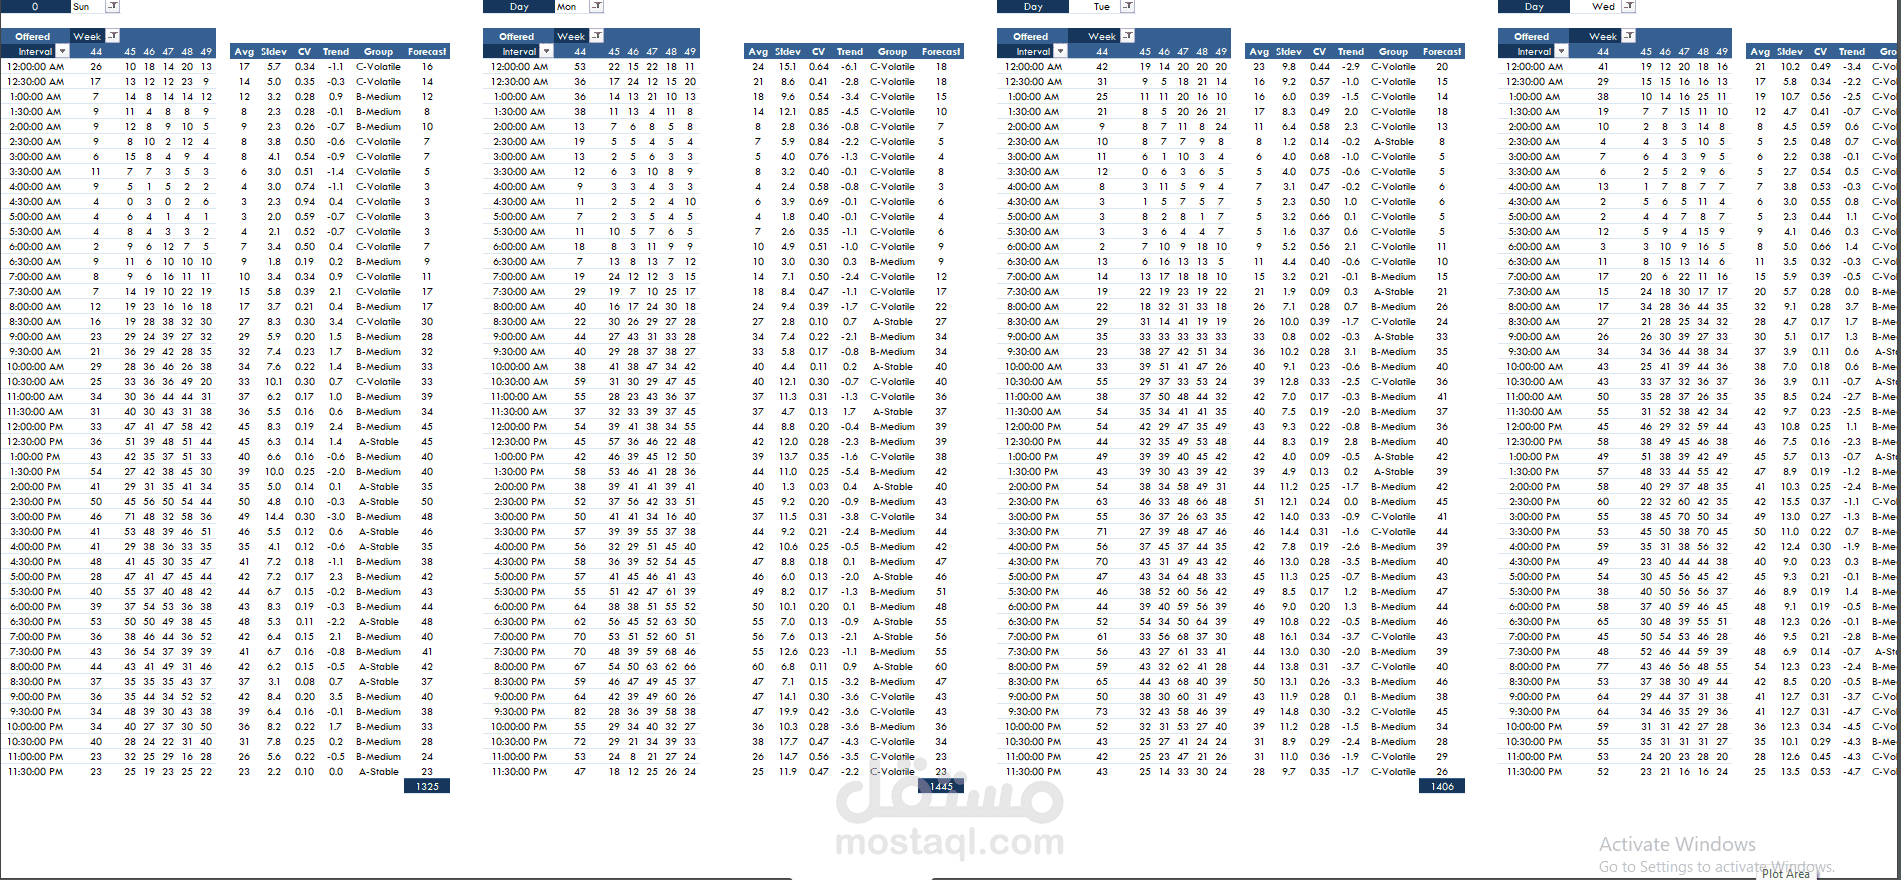
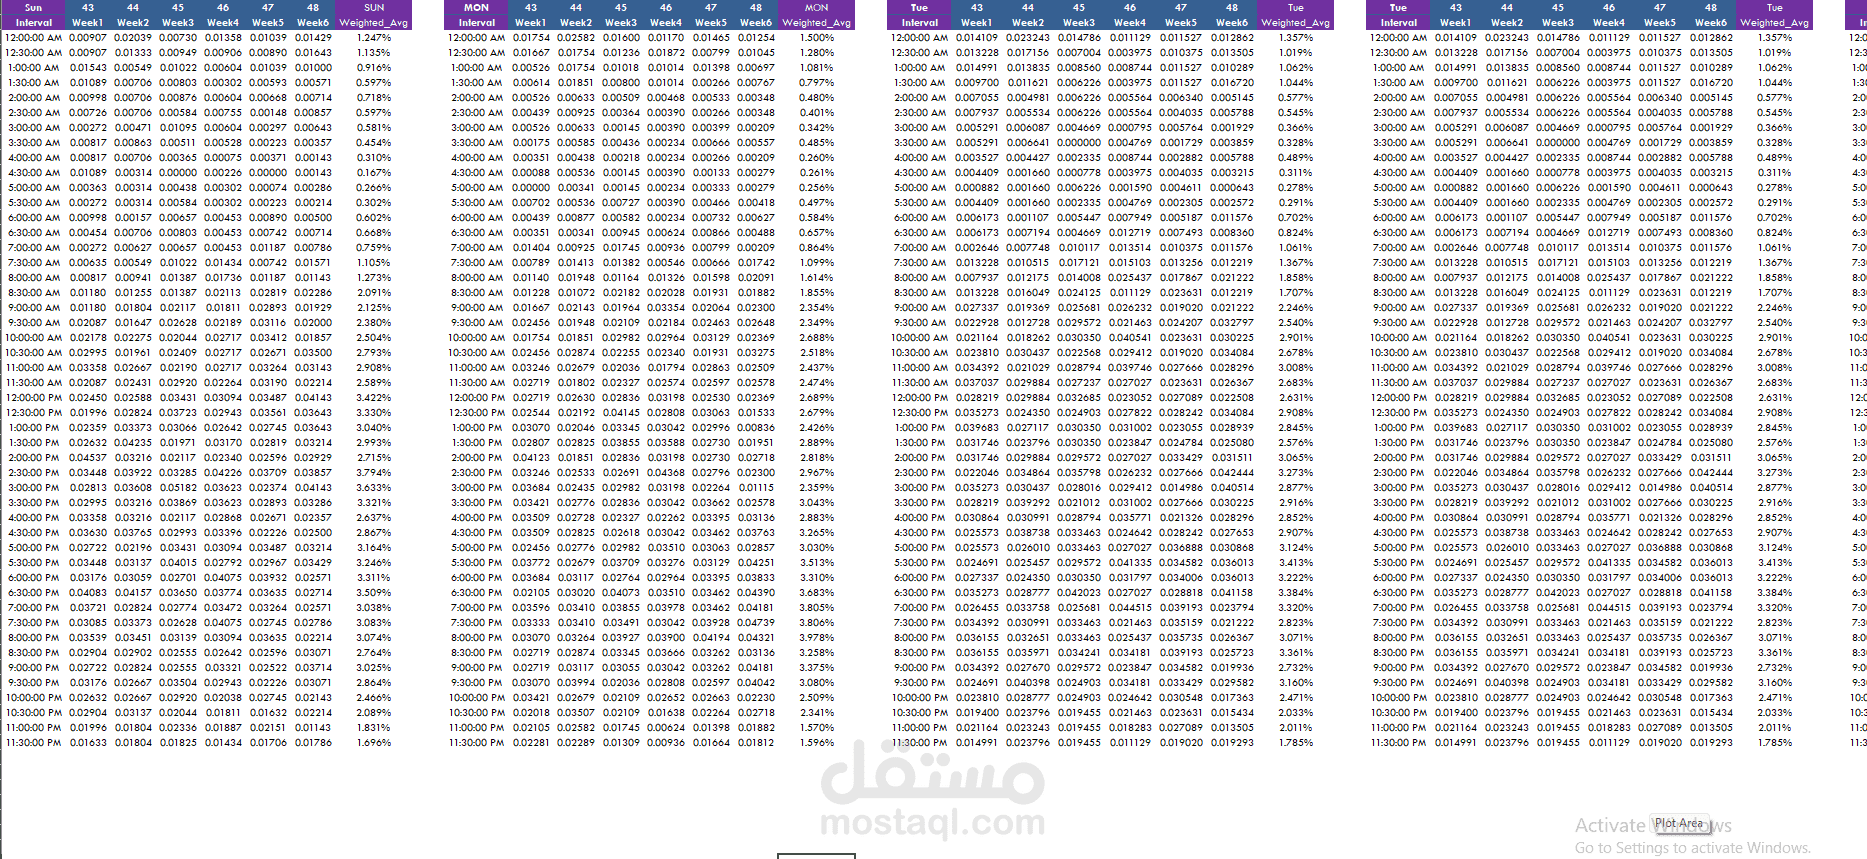
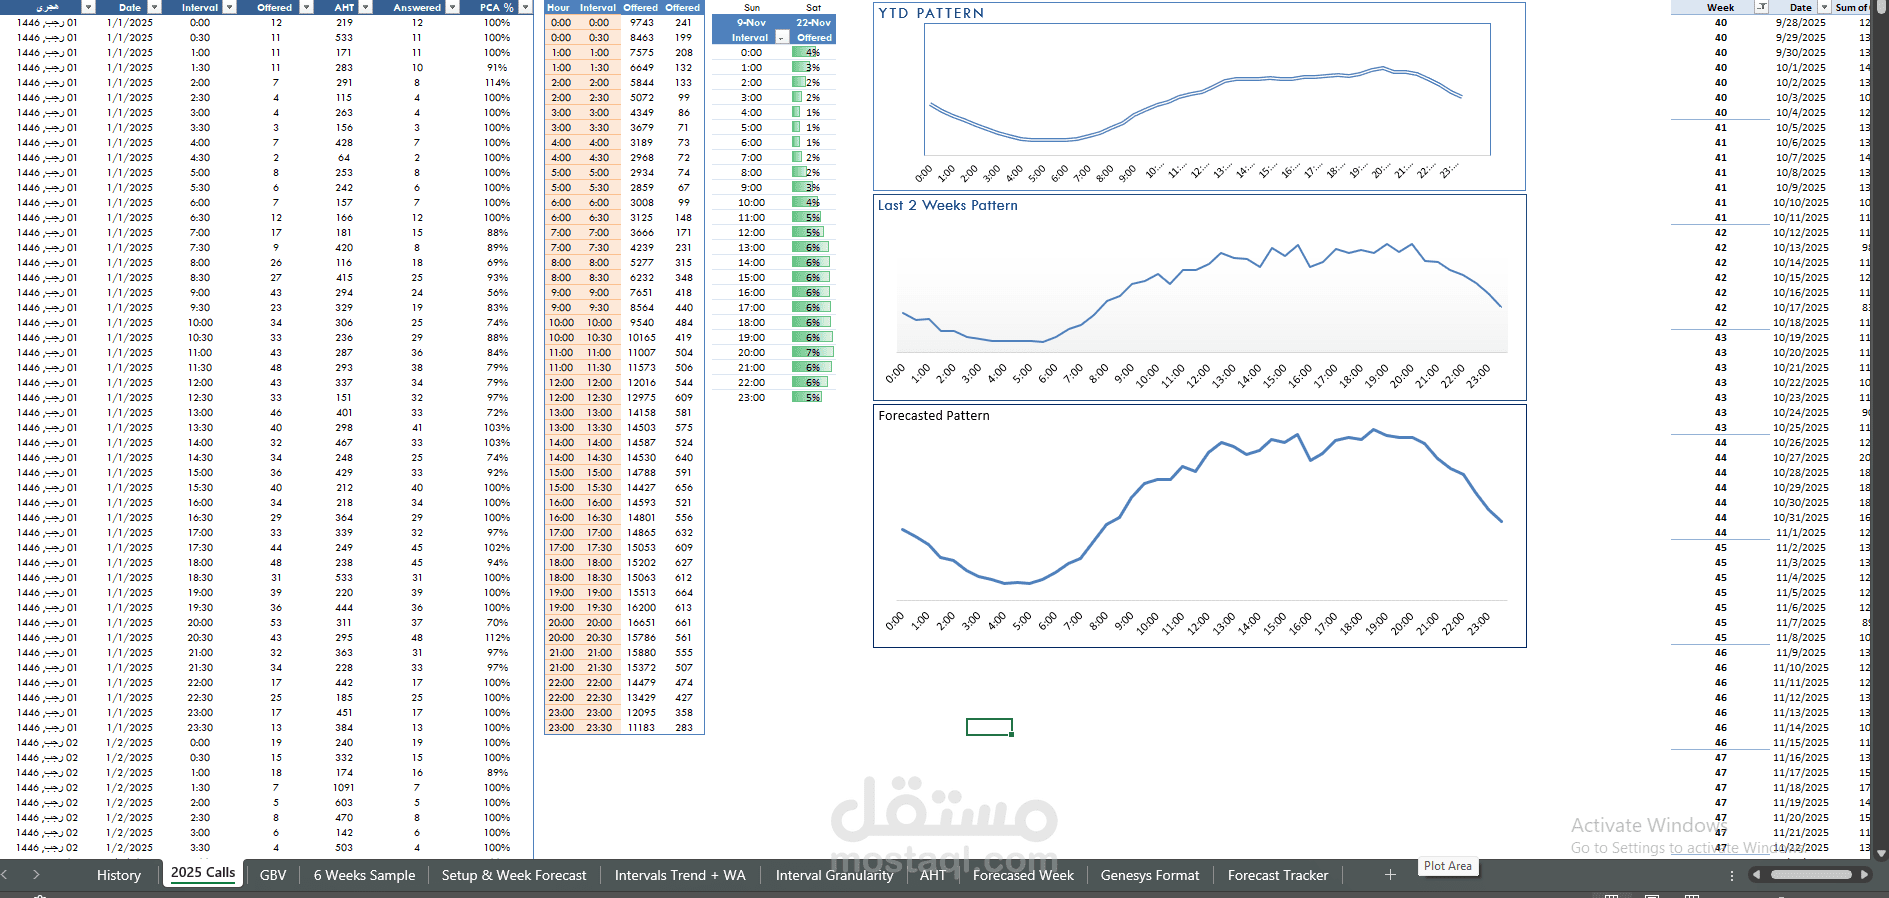
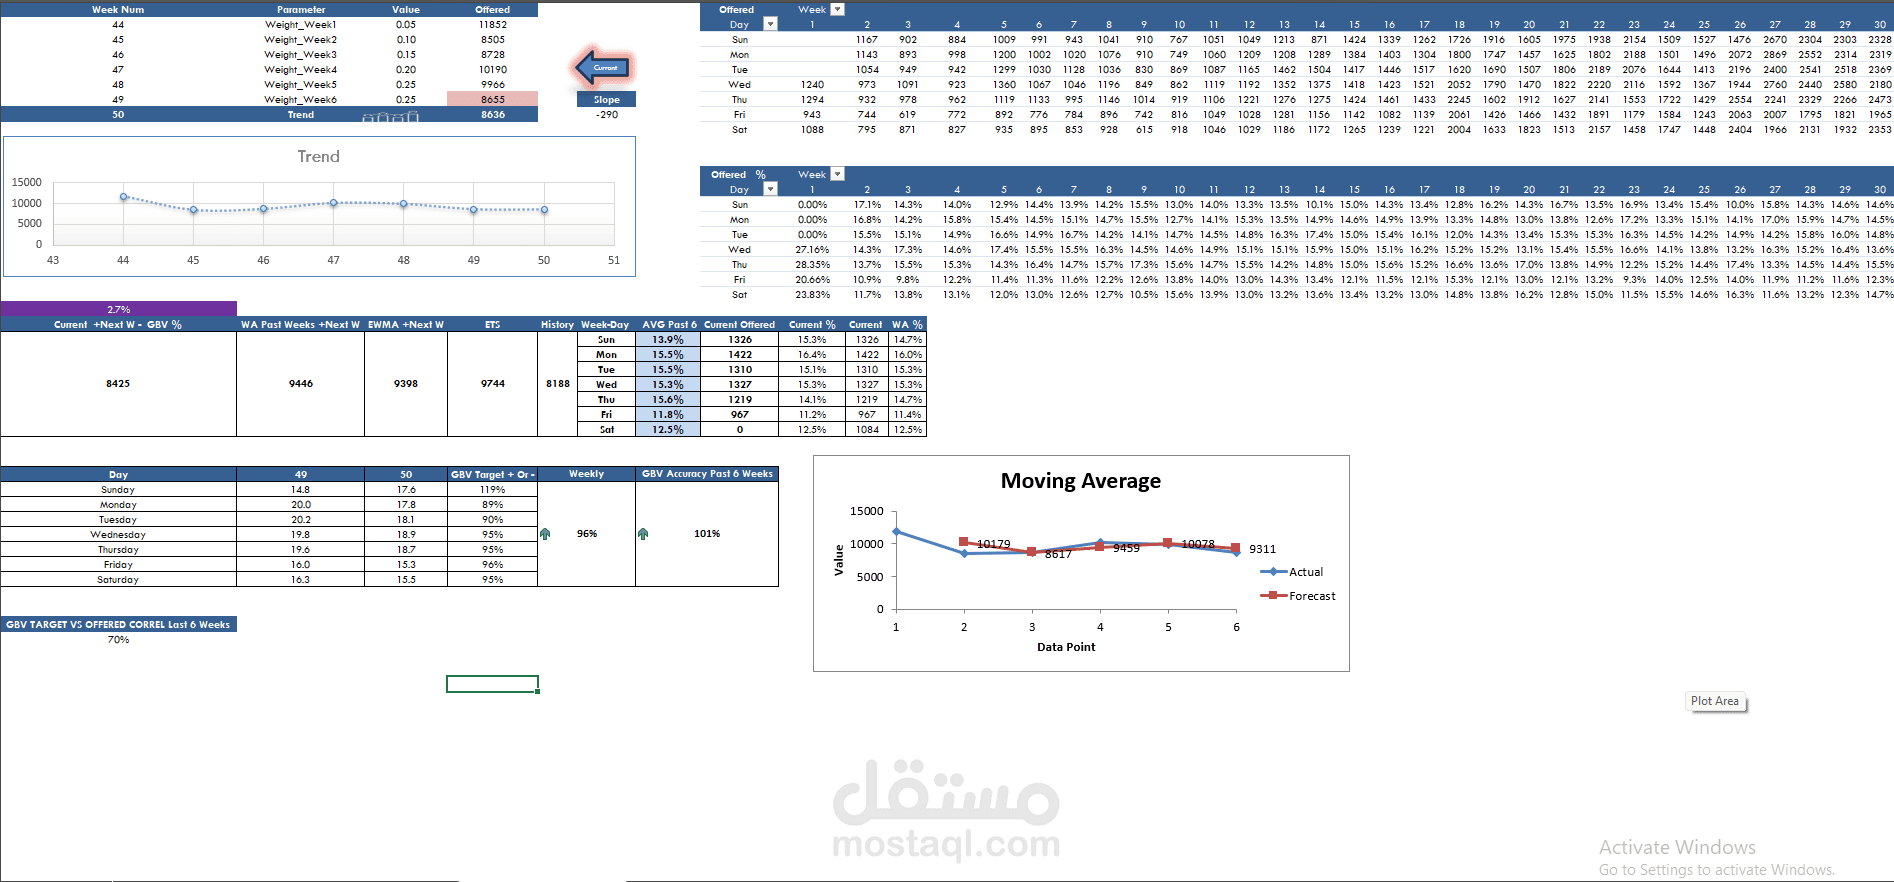
interval level workload forecast
Group historical data by interval of day (e.g., 08:00–08:30) and day of week . define weekday patterns
For each group collect the last 6–8 values (one per week).
Compute mean, σ, CV for the group. If CV is high (e.g., > 0.5) treat the forecast as high risk.
Detect outliers with Z-score; if outlier found, either remove or replace with trimmed value (e.g., mean of remaining values) before computing moving averages. Document any removals.
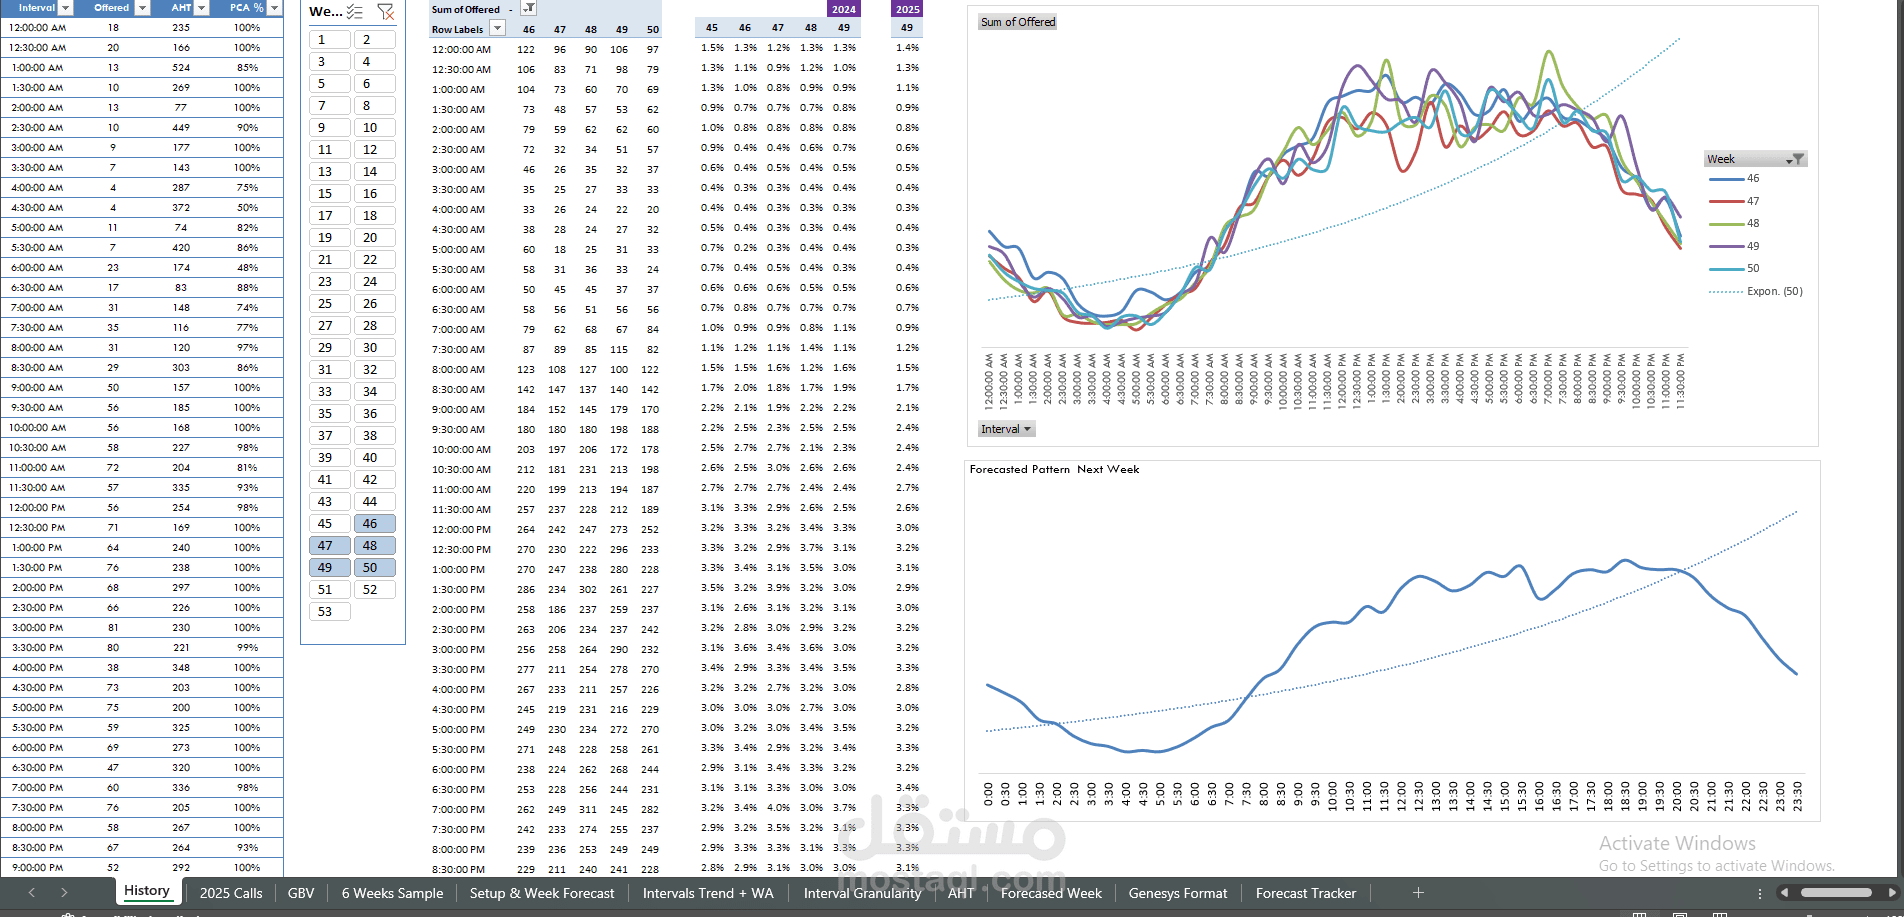
Compute SMA and WMA — WMA recommended if recent weeks are more indicative. Choose weights based on business judgment (typical decay factor 0.4→0.3→0.2→0.1 for 4 weeks; normalize for 6–8 weeks).
Produce forecast for the target upcoming day/interval using the WMA as baseline and report SMA as secondary.
Produce confidence band: e.g., Forecast ± 1σ (68% band) or ±1.96σ (95% band) using the interval σ. If residuals show seasonality, consider modeling residual variance separately.
Validate on hold-out week(s): compute MAPE, MAE, RMSE and compare methods; choose method with best historical performance.