
This project provides a complete pipeline—from data extraction with Selenium to comprehensive cleaning, preprocessing, and feature engineering—that transforms raw Yahoo Finance data into a robust dataset for in-depth financial analysis. By incorporating dividend and split information directly into the time series, the analysis not only captures price appreciation but also highlights the significant impact of dividend reinvestment on total shareholder returns. The resulting visualizations, including candlestick charts with technical markers and cumulative return comparisons, offer valuable insights into Apple's performance over different market cycles.
This project uses historical stock data for Apple Inc. (AAPL) scraped from Yahoo Finance. The goal is to build a robust dataset that includes both daily trading metrics and corporate actions (dividends and stock splits) to perform detailed financial analyses. Key analyses include:
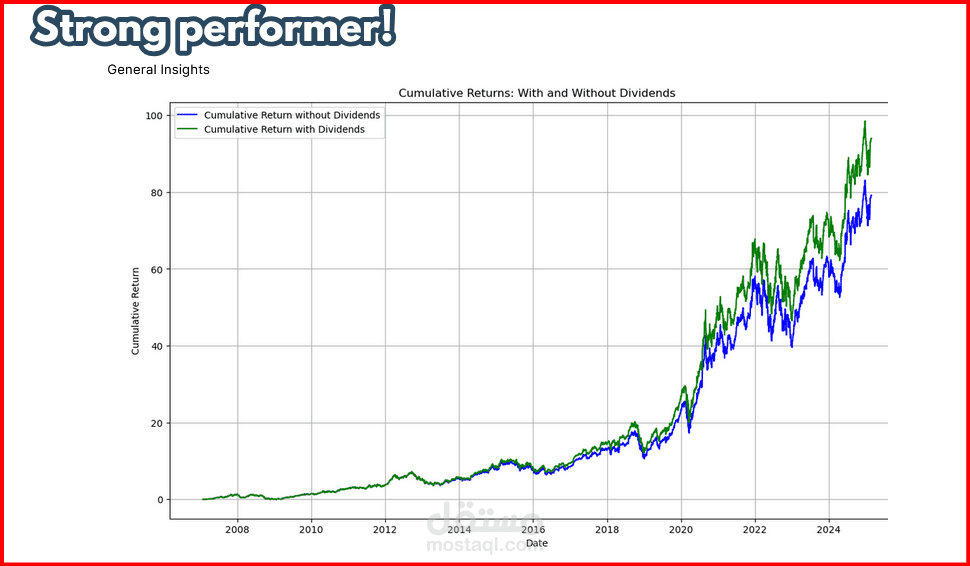
Cumulative Return Analysis: Comparing returns with and without dividend reinvestment.
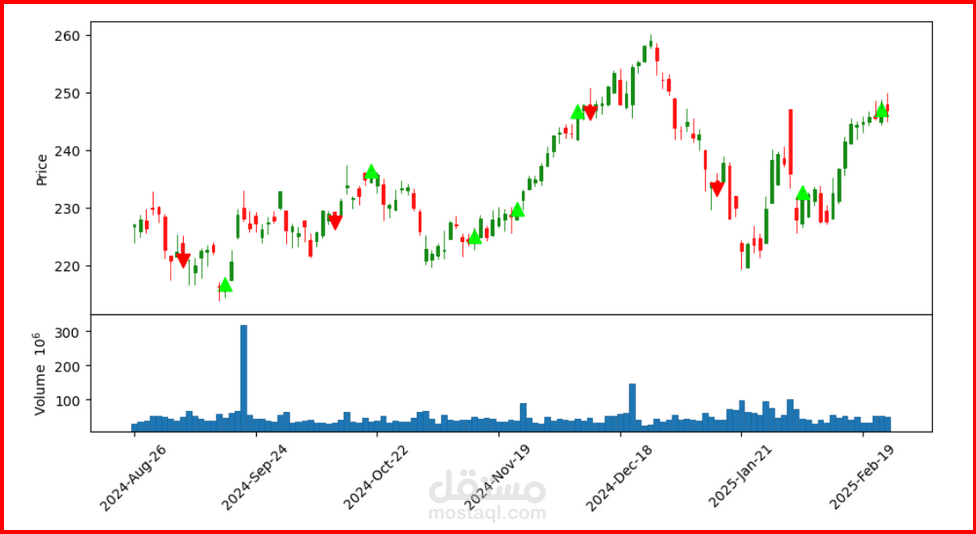
Candlestick Visualization: Annotating key events and technical patterns (e.g., bullish/bearish engulfing).
Trading Volume Trends: Analyzing how volume changes over time and across weekdays.
Data Source
Source: Yahoo Finance - AAPL Historical Data
Data Range: The scraper targets data from 2007 to 2025, ensuring that both crisis periods (like the 2008 recession) and post-crisis stability are captured.
Workflow
Data Extraction
Web Scraping with Selenium:
The script uses Selenium to automate browser interaction with Yahoo Finance.
It repeatedly clicks the “Show More” button to load the full historical dataset.
All table rows (<tr>) are collected for further processing.
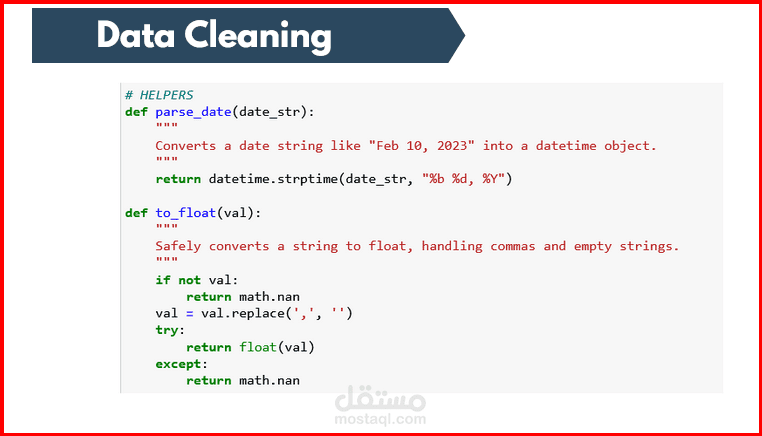
Data Cleaning
Date Parsing:
The raw date strings (e.g., "Feb 10, 2023") are converted into Python datetime objects using datetime.strptime.
Consistent date formats are ensured for accurate time-series analysis.
Handling Non-Numeric Data:
Commas are removed from numeric strings.
Trading columns such as Open, High, Low, Close, Adj Close, and Volume are converted from strings to floats.
Any conversion errors result in math.nan, allowing later filtering or imputation.
Data Preprocessing
Merging Different Row Structures:
Yahoo Finance provides two row types:
Trading Rows: 7-column rows with Open, High, Low, Close, Adj Close, and Volume.
Event Rows: 2-column rows indicating dividends (e.g., "0.23 Dividend") or splits (e.g., "4-for-1 Split").
A dictionary is used to merge these row types by date:
Key: Parsed date.
Value: A dictionary containing all fields, initially set to NaN for missing values.
The merging step ensures a single, comprehensive record per date.
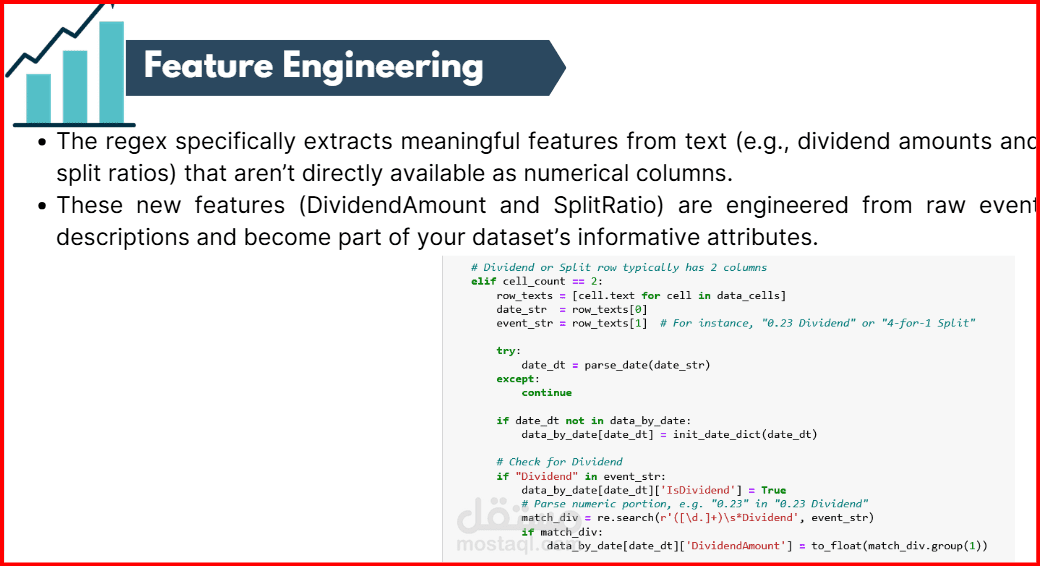
Feature Engineering
Incorporating Corporate Actions:
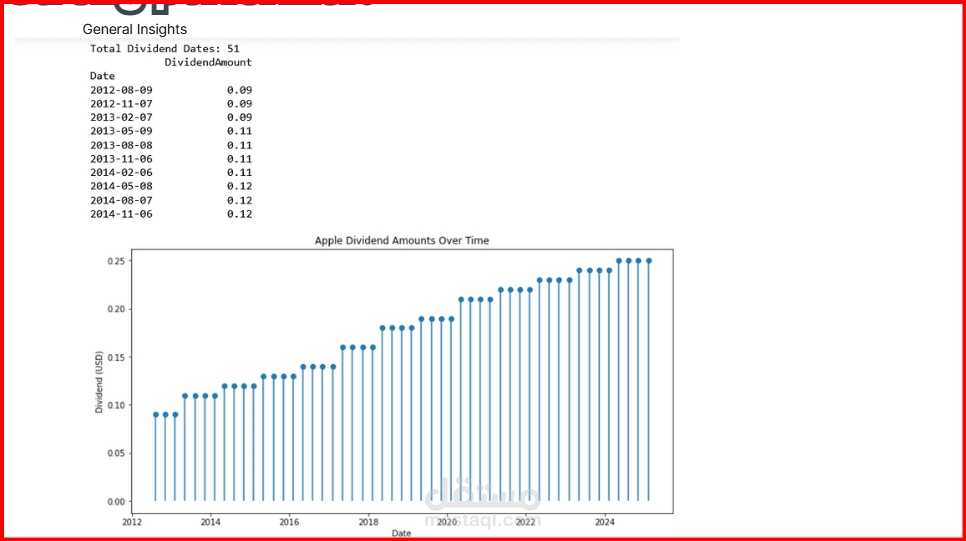
Dividends:
The script identifies dividend rows by checking if the event text contains "Dividend."
It sets the flag IsDividend to True and uses a regex (r'([\d.]+)\s*Dividend') to extract the dividend amount, which is stored in DividendAmount.
Splits:
Similarly, the script checks for "Split" in the event text.
It sets IsSplit to True and extracts the split ratio using a regex (r'(\d+)[^\d]*Split'), storing the value in SplitRatio.
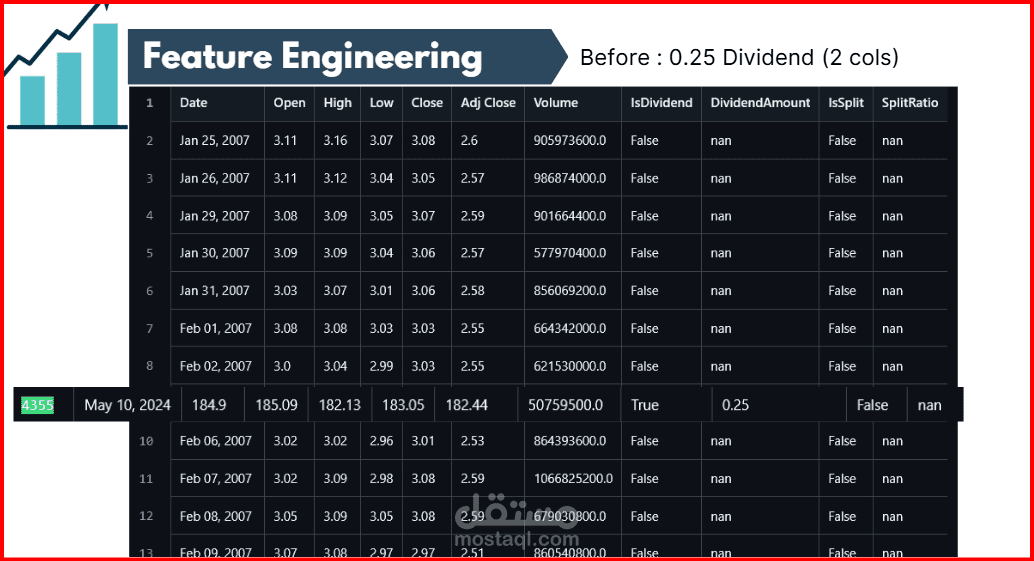
Enhancing the Dataset:
New columns (IsDividend, DividendAmount, IsSplit, SplitRatio) are added to each date’s record.
This transformation (from raw event text to numeric/boolean features) is a critical part of feature engineering, enabling detailed analysis of dividend and split impacts.
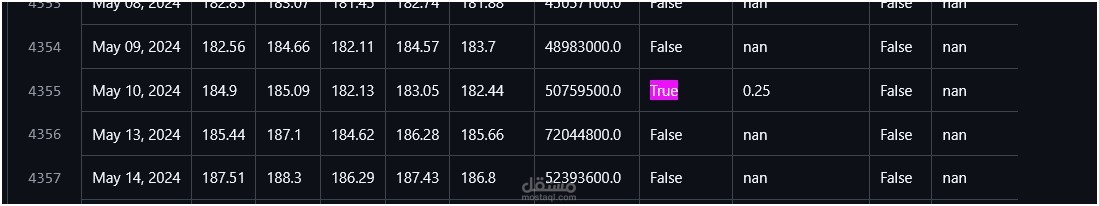
Final Output:
The merged data is sorted chronologically and written to a CSV with columns:
['Date', 'Open', 'High', 'Low', 'Close', 'Adj Close', 'Volume', 'IsDividend', 'DividendAmount', 'IsSplit', 'SplitRatio'].
Analysis & Visualization
Candlestick Charts with Dividend & Split Markers
Purpose:
Visualize daily price movements using candlestick charts, augmented with markers for engulfing patterns and corporate events.
Method:
Filter data for specific periods (e.g., last 6 months, 2024, or crisis periods).
Detect technical patterns like bullish and bearish engulfing.
Overlay markers on candlestick charts using mplfinance’s addplot.
Insight:
Helps identify potential reversal signals and visually correlate corporate actions with price dynamics.
Cumulative Returns with and Without Dividends
Purpose:
Compare total shareholder return by computing cumulative returns based on both the Close (price appreciation only) and Adj Close (total return, including dividends).
Method:
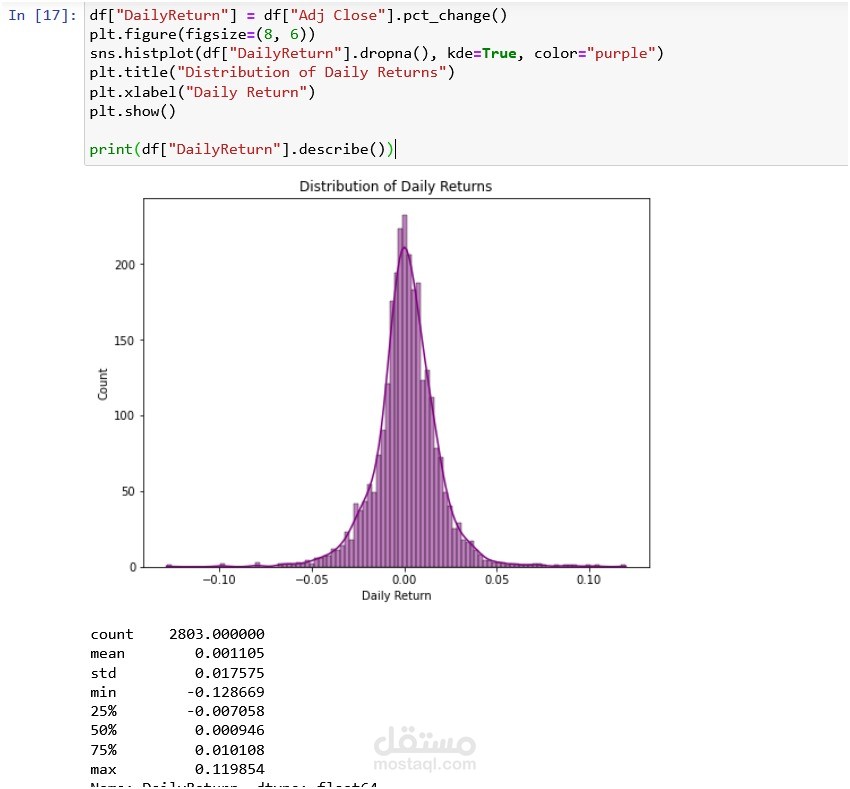
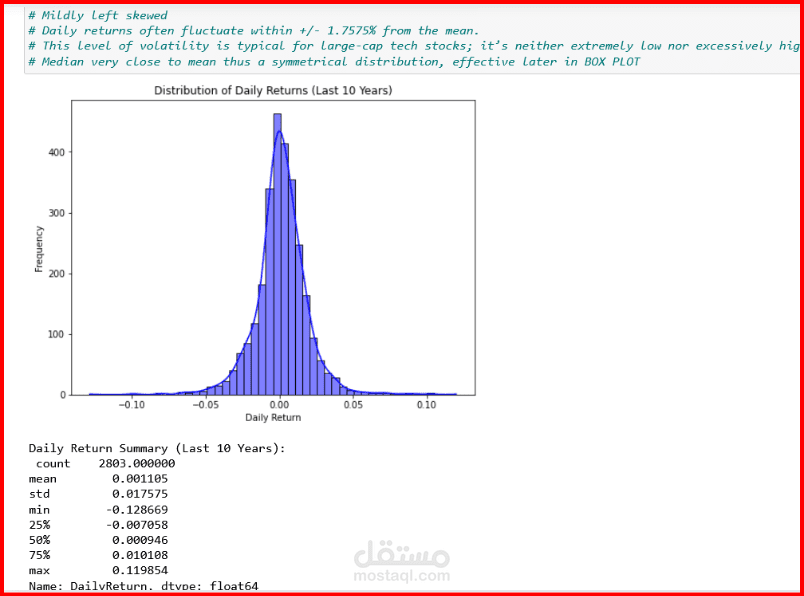
Calculate daily percentage changes.
Compute cumulative products to determine total return over time.
Plot the two cumulative return series for direct comparison.
Insight:
Demonstrates how dividend reinvestment can significantly boost long-term performance.
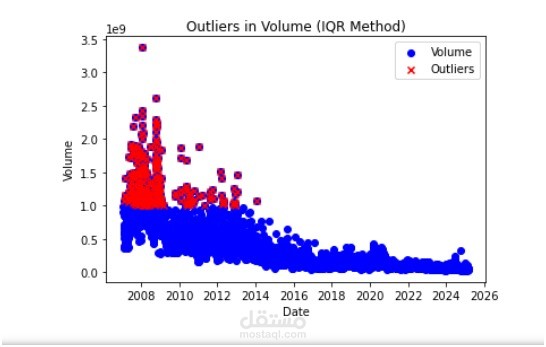
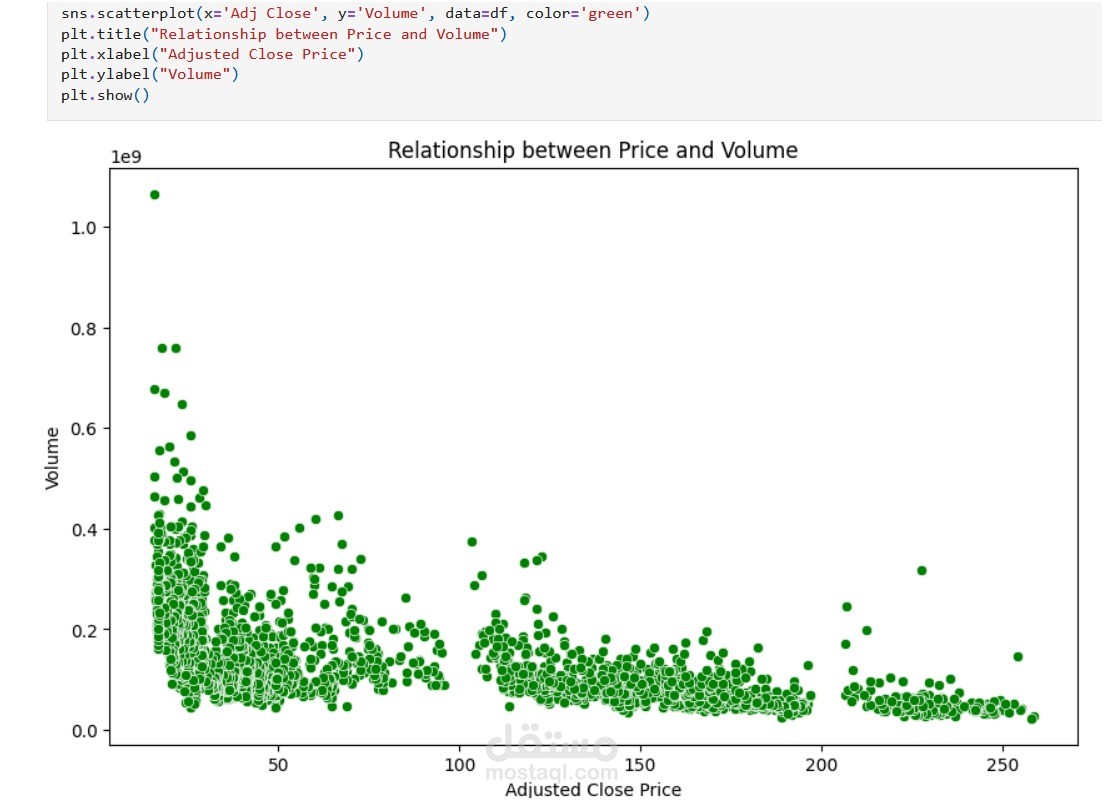
Trading Volume Analysis
Purpose:
Analyze trends in trading volume over time and by day of the week.
Method:
Resample the data by month to compute average trading volumes.
Group data by weekday to identify the busiest trading days.
Plot these as bar charts or scatter plots.
Insight:
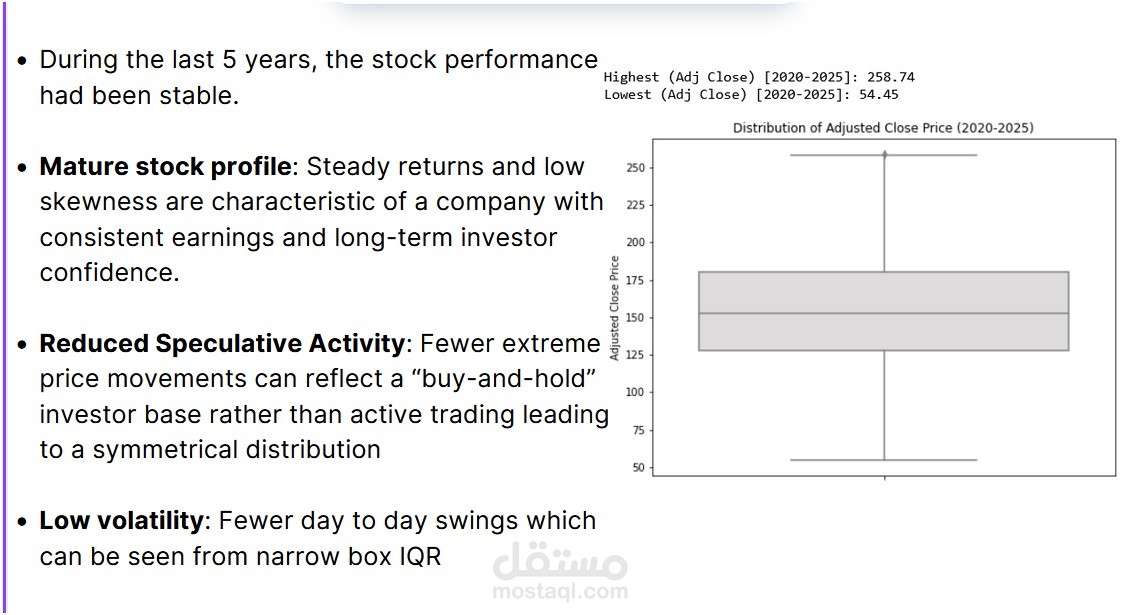
Provides context on market activity, liquidity, and investor sentiment—e.g., lower trading volumes in mature phases may indicate a stable, long-term holding pattern.
| اسم المستقل | Mohamed A. |
| عدد الإعجابات | 0 |
| عدد المشاهدات | 14 |
| تاريخ الإضافة | |
| تاريخ الإنجاز |