Call Center Performance Dashboard
تفاصيل العمل
Call Center Performance Dashboard
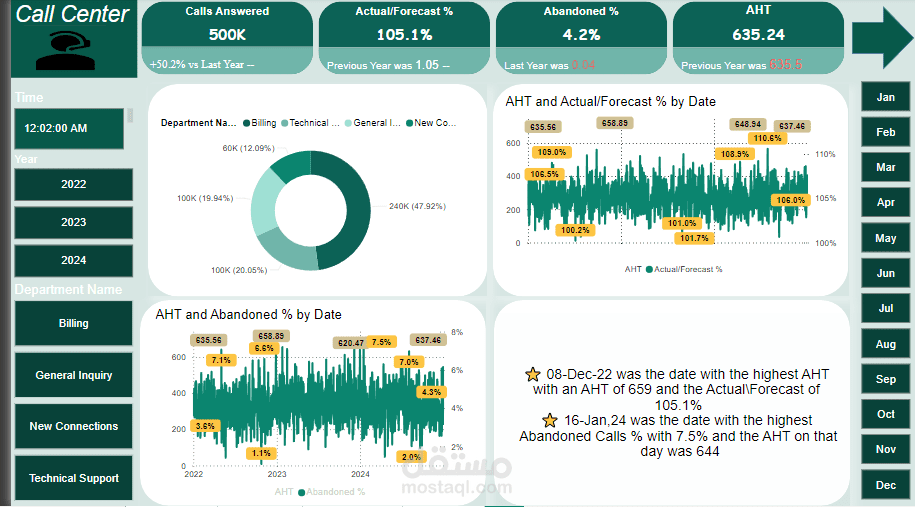
This Power BI dashboard provides a comprehensive view of call center performance across critical metrics, offering a clear snapshot of call handling, agent productivity, customer satisfaction, and efficiency. The layout is designed for easy interpretation, with insights presented at both the individual agent level and overall call center performance.
Key Metrics Displayed:
Total Calls Handled: 45K, representing the volume of calls processed.
Average Handle Time (AHT): 5.2 minutes, indicating the average time taken to manage a call.
First-Call Resolution (FCR) Rate: 75%, showing the percentage of calls resolved in the first interaction.
Customer Satisfaction (CSAT): 82%, providing an indicator of customer service quality.
Abandonment Rate: 6%, the percentage of calls dropped before connection.
Agent Utilization Rate: 78%, measuring agent efficiency in managing calls.
Visual Components:
Map Visualization: Displays call volumes by region, allowing managers to identify high-demand areas and allocate resources accordingly.
Stacked Bar Chart: Shows agent productivity, categorizing performance by metrics such as calls handled, call duration, and resolution rate. This provides insights into agent efficiency and highlights top-performing agents.
Line Chart: Tracks trends in average handle time and call volume over time, with a forecast line predicting future performance based on historical data.
Gauge Charts: Display CSAT and FCR rates, with dynamic colors (green, yellow, red) for a quick visual indication of satisfaction and resolution rates.
Heatmap by Time of Day: Highlights peak hours, helping managers optimize staffing during high-demand periods.
Design and Color Scheme
The dashboard utilizes a color-coded system where green indicates target achievement, yellow highlights metrics near target thresholds, and red alerts low-performance areas. A clean layout places key metrics on a sidebar for quick access, while interactive charts are centered, allowing easy exploration of data across different filters.
Insights Gained
The dashboard reveals:
High-Volume Regions: Regions with the highest call volumes, aiding in staffing decisions.
Top-Performing Agents: Identifies agents with exceptional productivity and efficiency metrics.
Peak Call Times: Analysis of call times supports optimized scheduling.
Customer Satisfaction Drivers: Trends in CSAT scores by call type highlight areas for improving service quality.
This dashboard serves as a vital tool for monitoring and enhancing call center operations, driving efficiency, and elevating customer satisfaction by enabling data-driven decisions.
