Key Performance Indicators (KPIs):
Sales Revenue: Total revenue generated from sales within a specific time period.
Sales Growth: Percentage increase or decrease in sales revenue compared to a previous period.
Sales Pipeline: The number and value of deals at each stage of the sales process, providing insight into the health of future sales.
Conversion Rate: Percentage of leads or prospects that convert into customers.
Average Deal Size: Average value of a sales deal.
Customer Acquisition Cost (CAC): The cost associated with acquiring a new customer.
Customer Lifetime Value (CLV): The predicted revenue that a customer will generate over their lifetime as a customer.
Sales Performance Metrics:
Total Sales: Sum of all sales transactions within a specific period.
Sales by Product/Service: Breakdown of sales revenue by individual products or services.
Sales by Region/Territory: Geographic breakdown of sales performance.
Sales by Sales Representative: Performance comparison among sales team members.
Sales by Channel: Breakdown of sales revenue by different sales channels (e.g., online, offline, direct, indirect).
Sales Funnel Visualization:
Visual representation of the sales funnel, showing the number of leads at each stage of the sales process (e.g., prospecting, qualification, proposal, closing).
Conversion rates between each stage to identify bottlenecks and areas for improvement.
Trend Analysis and Forecasting:
Historical sales data presented graphically to identify trends and patterns.
Forecasted sales based on historical data, allowing for predictive analysis and planning.
Customer Insights:
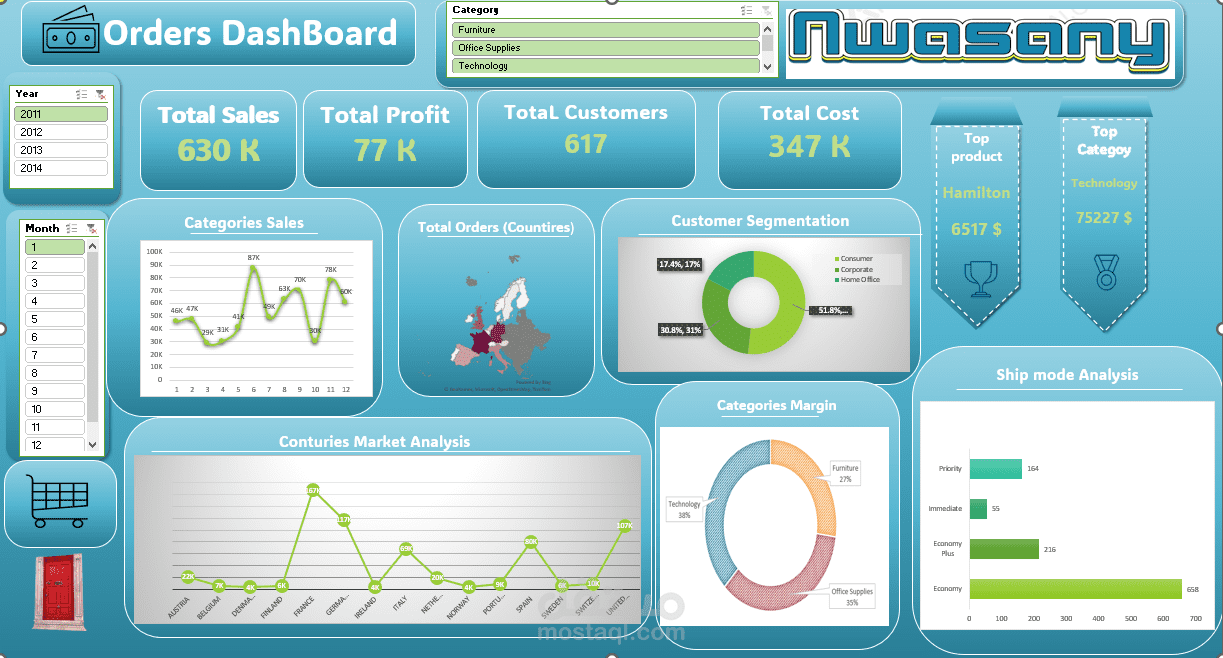
Customer Segmentation: Analysis of customer demographics, behavior, and buying patterns to identify high-value segments.
Customer Retention: Metrics related to customer churn rate, retention rate, and repeat purchases.
Performance Targets and Goals:
Comparison of actual sales performance against predefined targets and goals.
Progress towards sales quotas and objectives for individuals, teams, or regions.
Data Visualization:
Graphs, charts, and other visualizations to present sales data in a clear and understandable format.
Interactive features allowing users to drill down into specific data points for deeper analysis.
Real-time Updates:
Ability to update data in real-time or near real-time to provide the most current insights.
Alerts and notifications for significant changes or deviations from expected performance.
Customization and Flexibility:
Ability to customize the dashboard layout, metrics, and visualizations based on the unique needs and preferences of users.
Integration with other data sources and systems such as CRM software, ERP systems, and marketing platforms.
| اسم المستقل | Ibrahim A. |
| عدد الإعجابات | 0 |
| عدد المشاهدات | 17 |
| تاريخ الإضافة | |
| تاريخ الإنجاز |