IMS data analysis (retail and territories)
تفاصيل العمل
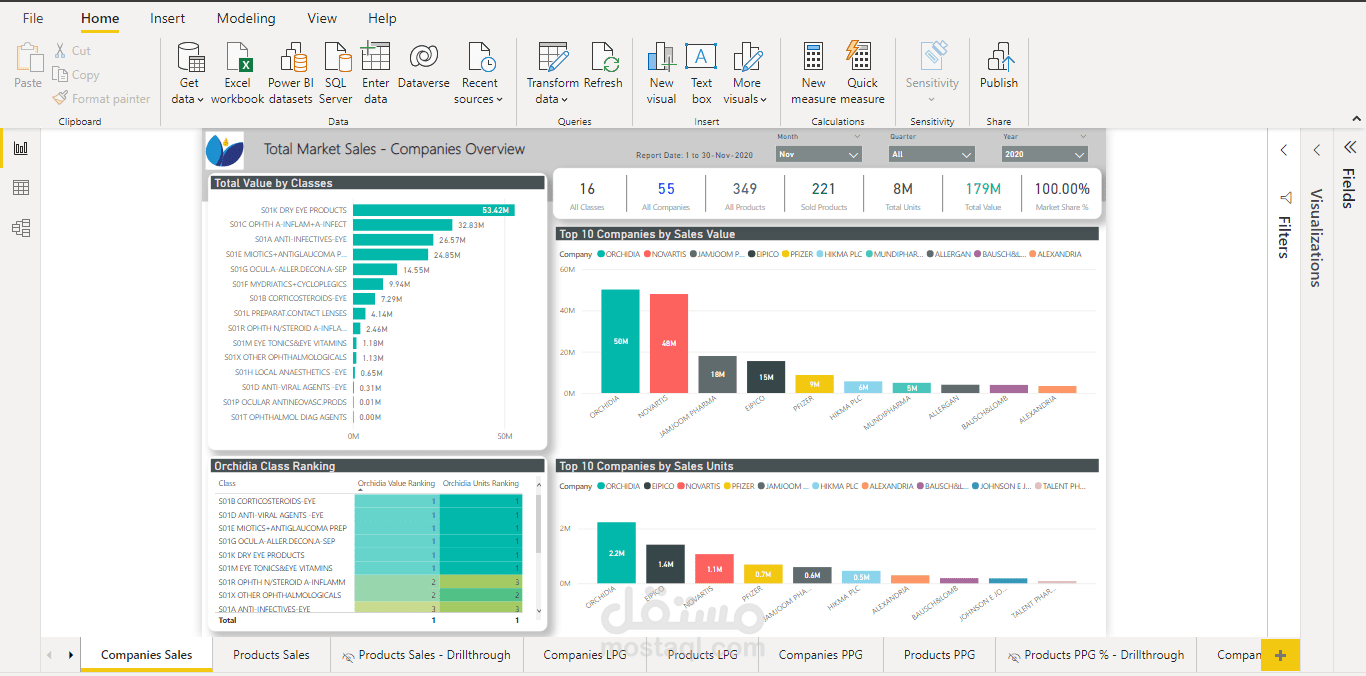
final report will be as pic above "Microsoft Power BI" file with many sheets as examples below:
there're another reports by Microsoft PowerPoint, Microsoft Excel and Microsoft Word
all companies sorted descending by units and another chart for value
all items sorted descending by units and another chart for value
LPG% Units and Value (Last Period Growth) - current month vs last month
PPG% Units and Value (Previous Period Growth) - current year vs last year.
Monthly Trend for our products and competitors.
bricks sales comparison between our items and competitors.
the same comparison for all structure levels (Reps, Supervisors, Teams, and managers).
Power PIVOT Tables.