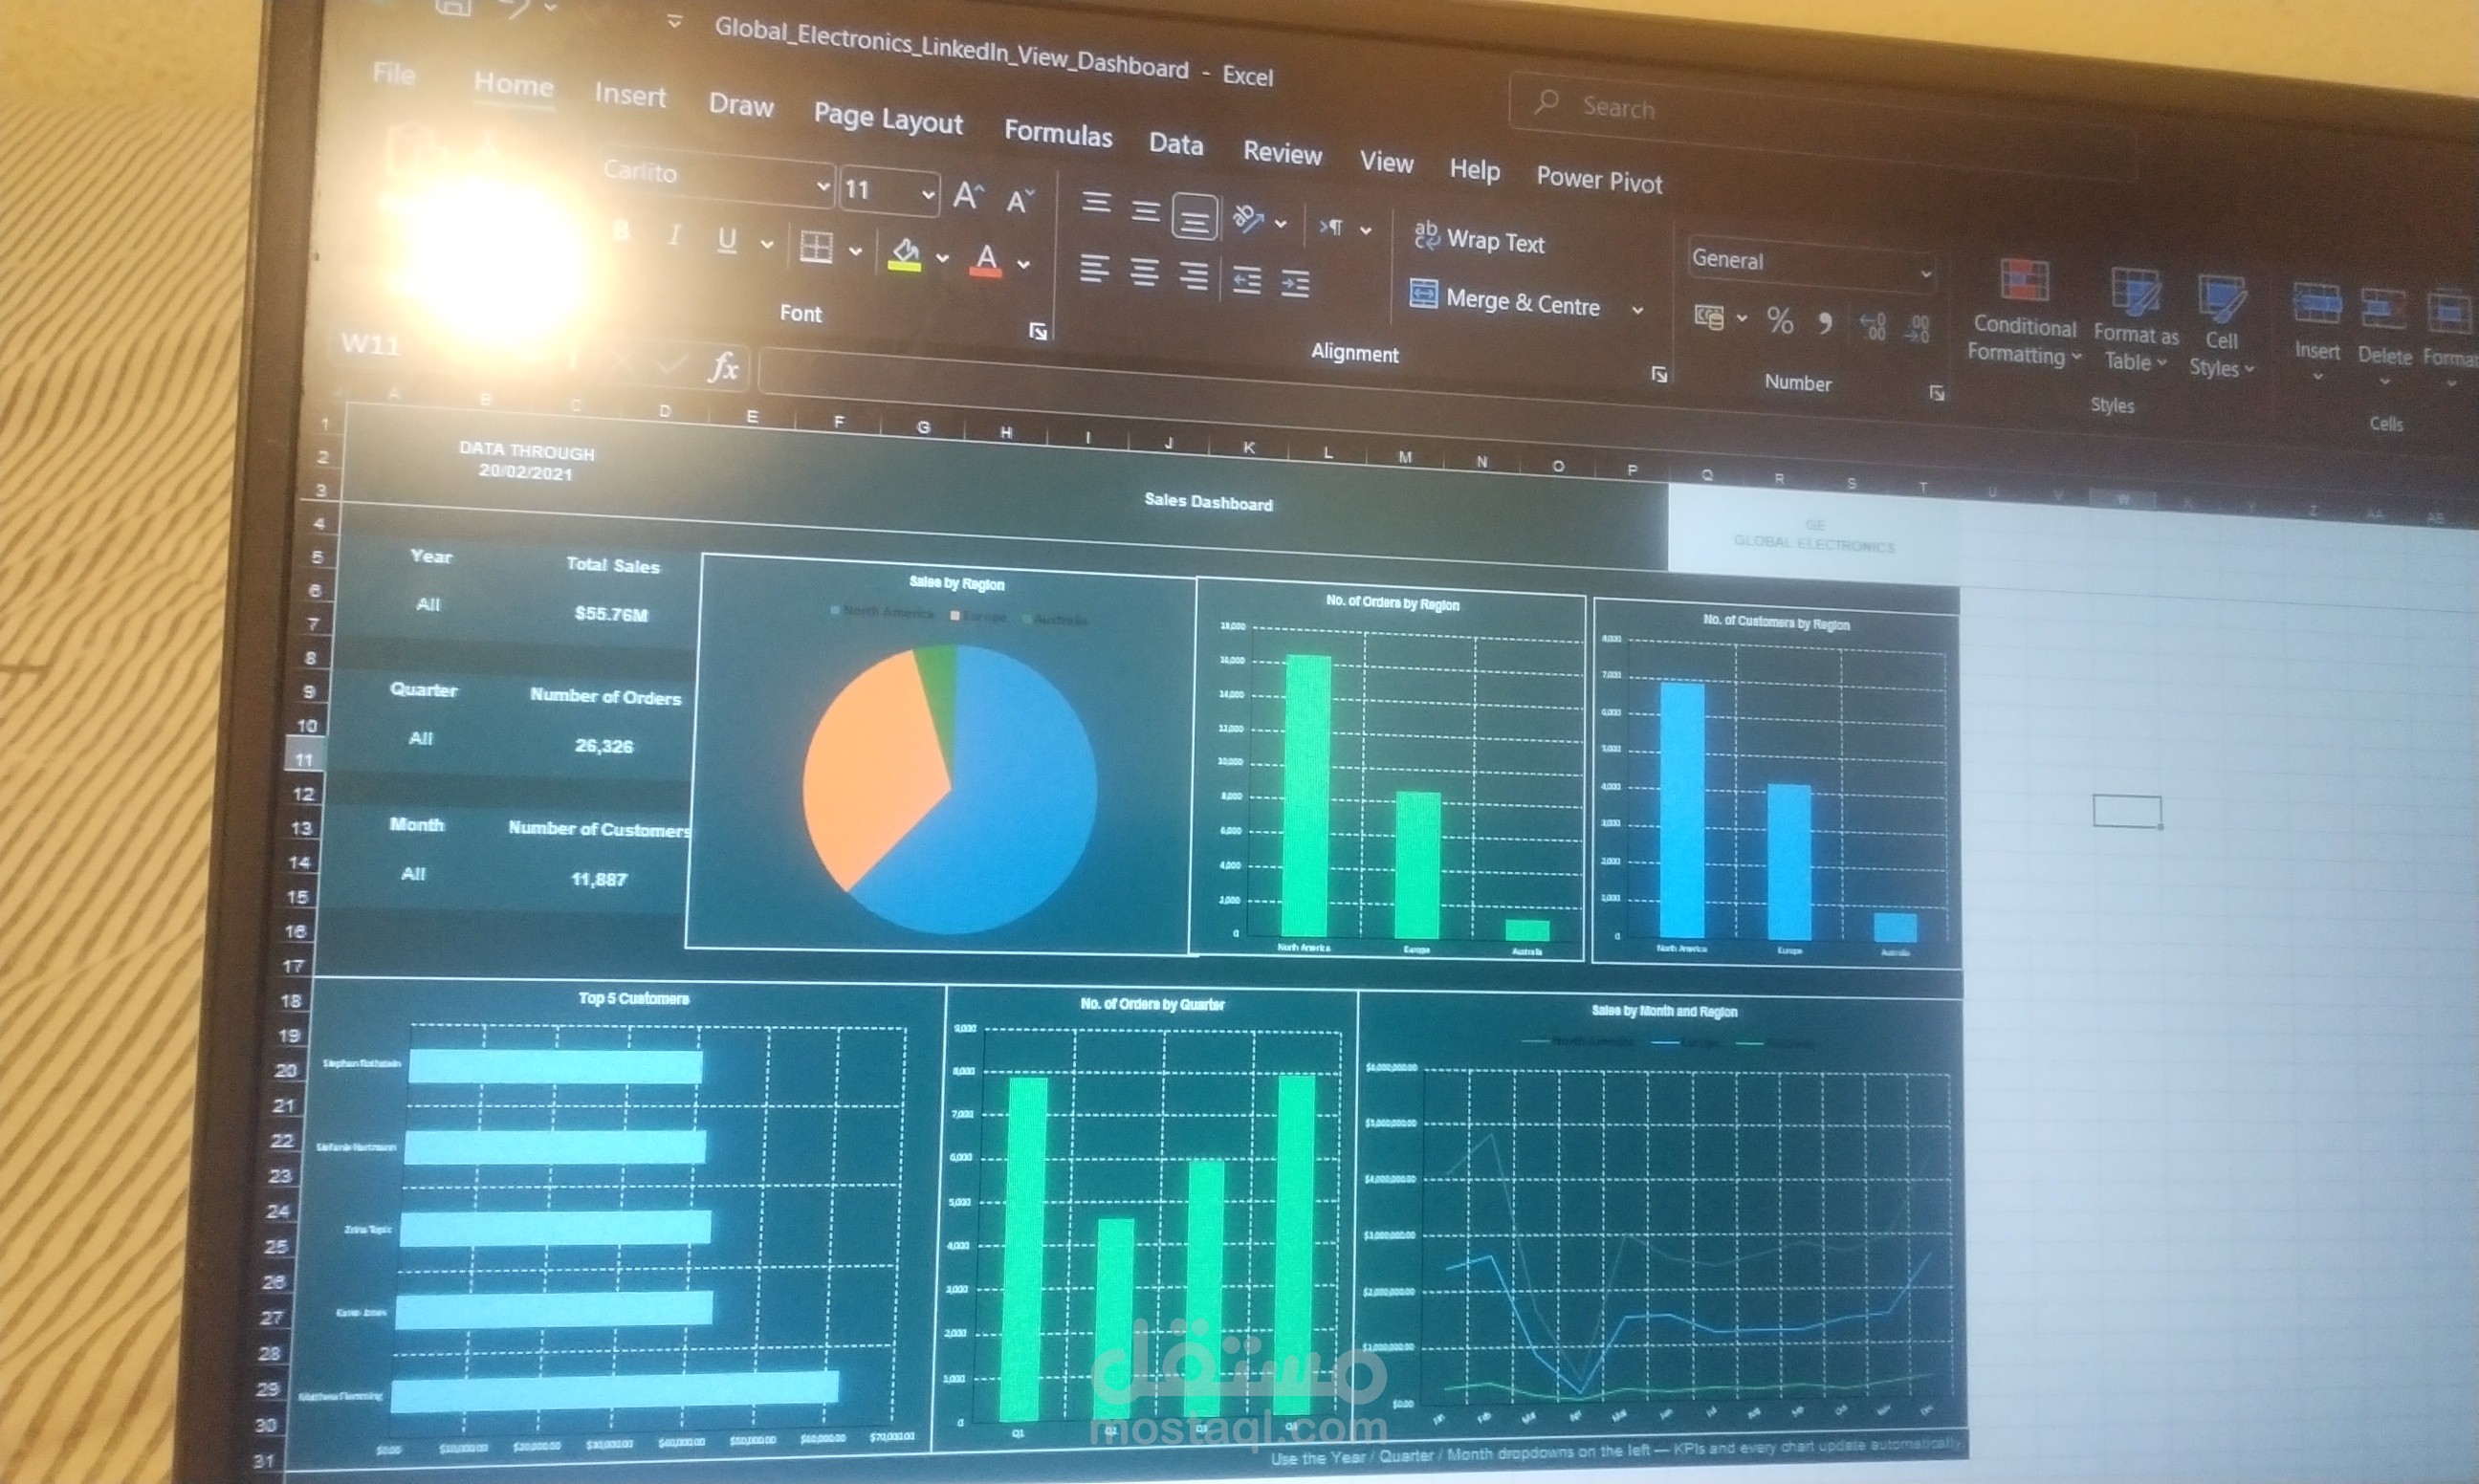
Sales dashboard
تفاصيل العمل
(3) Create Pivot tables and Suitable Charts for the following:
1. Total sales over years.
2. Total sales monthly trend.
3. Sales by branch country.
4. Top 7 branch states based on sales.
5. Bottom 7 branch sates based on sales.
6. Sales % by category.
7. Top 5 subcategories by sales, and their sold quantity.
8. Bottom 5 subcategories by sales, and their sold quantity.
9. Sales % by brand.
10. Top 3 demanded colors (highest quantity sold).
11.Customers % by continent.
12. Sales % by customer gender.
13. Sales % by customer country.
14. Top 7 customer states by sales.
(4) Build dashboard(s) showcasing key insights extracted.