Sales Analytics dashboard
تفاصيل العمل
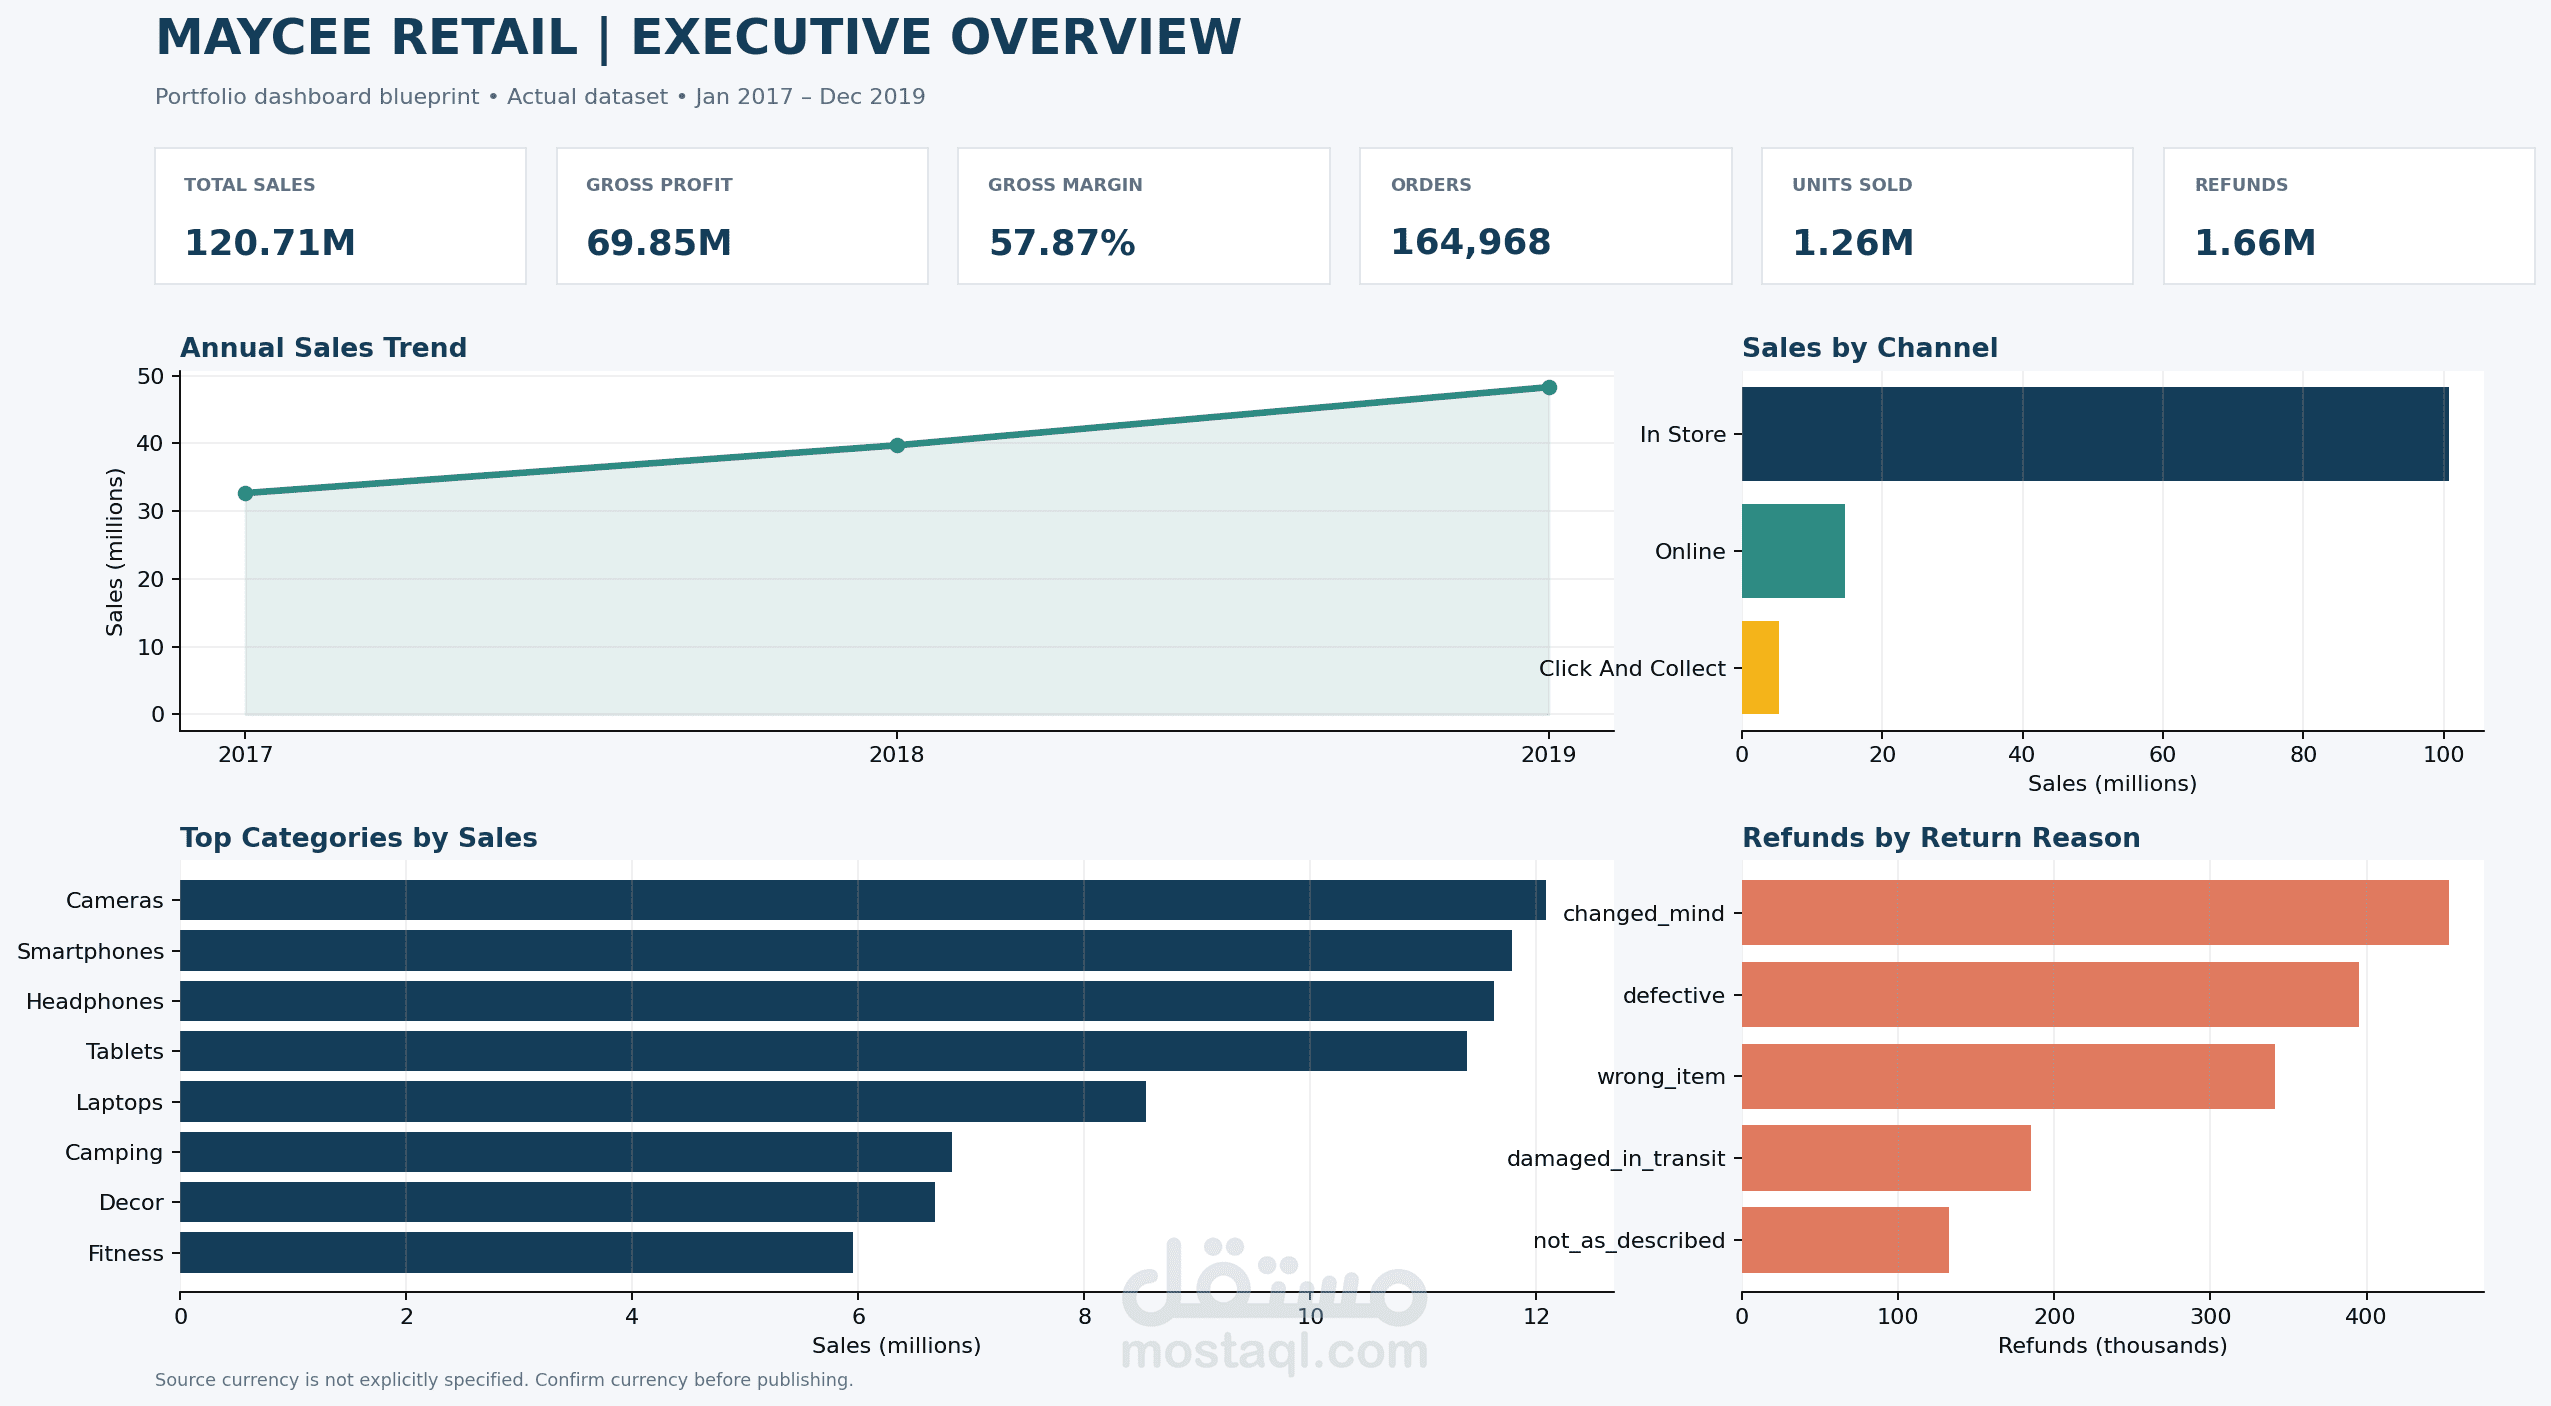
Global Electronics Retailer Sales Analysis
The data provided contains annual transactional records of a global electronics retailer.
There are four comma-separated files of four tables:
• Customers.csv
• Products.csv
• Sales.csv
• Stores.csv
(1) Create a data model by connecting the tables using primary and foreign keys.
(2) Extract the following insights by using DAX Measures.
1. Total Sales.
Hint1: You will first have to create a calculated column of Sales.
Hint2: since we have different currencies: Sales = Quantity*Unit Price.
2. Quantity sold, Total Orders.
3. Average Orders Value (AOV = Total Sales / Total Orders).
4. Number of customers (customers who actually made an order).
5. Average number of orders per customer (=Total Orders/Total Customers).
6. Average quantity purchased per order (= Quantity Sold/Total Orders).
7. Total Cost.
Hint: First you have to create a calculated column of Cost = Quantity*Unit Cost.
8. Total Profit.
Hint: (Profit = Sales – Cost).
9. Profit Margin %10. Average number of orders per day (= Total Orders/Number of days (unique dates))10. Average number of orders per day (= Total Orders/Number of days (unique dates))(3) Create Pivot tables and Suitable Charts for the following:
1. Total sales over years.
2. Total sales monthly trend.
3. Sales by branch country.
4. Top 7 branch states based on sales.
5. Bottom 7 branch sates based on sales.
6. Sales % by category.
7. Top 5 subcategories by sales, and their sold quantity.
8. Bottom 5 subcategories by sales, and their sold quantity.
9. Sales % by brand.
10. Top 3 demanded colors (highest quantity sold).
11.Customers % by continent.
12. Sales % by customer gender.
13. Sales % by customer country.
14. Top 7 customer states by sales.
(4) Build dashboard(s) showcasing key insights extracted.