AI-Powered Production Cost Optimizer (Steepest Descent)
تفاصيل العمل
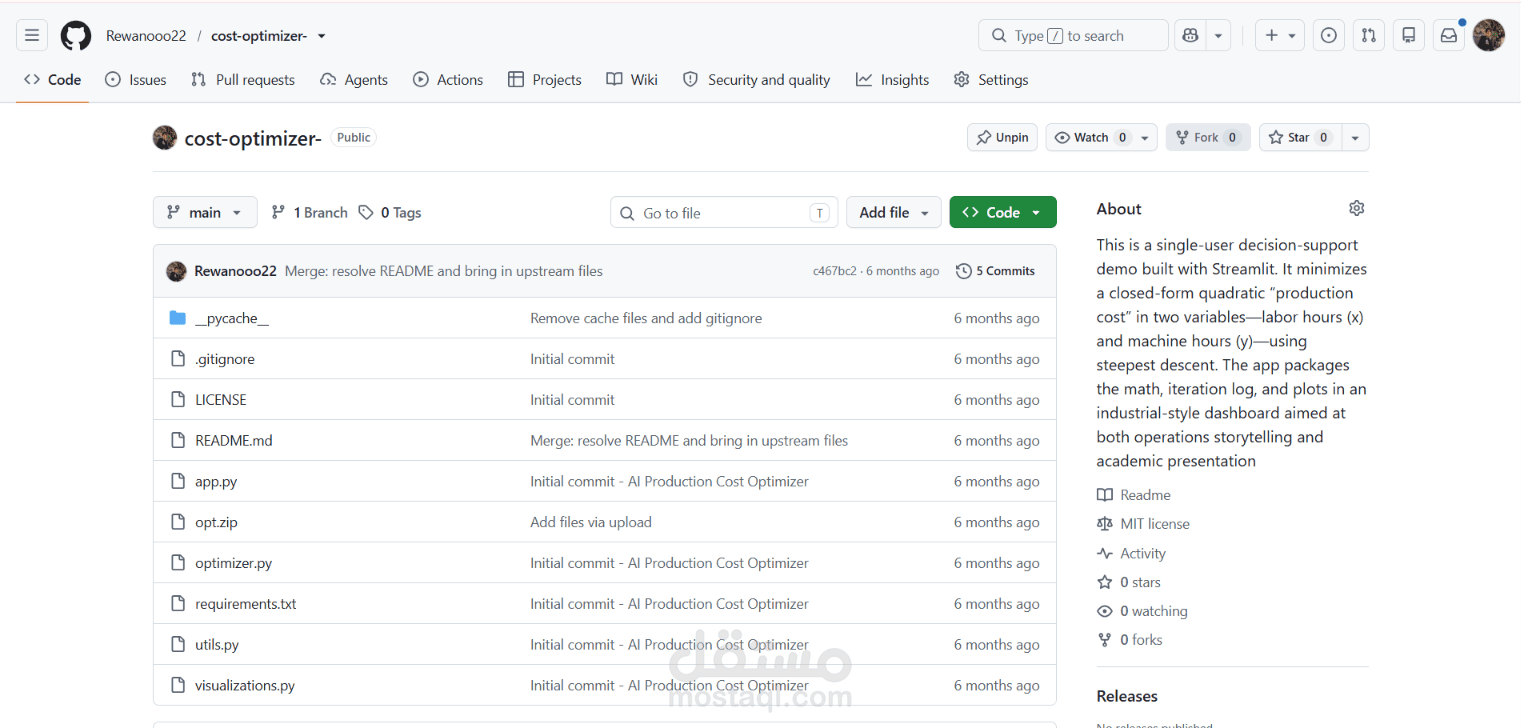
This single-user decision-support demo is an industrial-style Streamlit dashboard that minimizes a quadratic production cost in labor hours x and machine hours y using steepest descent (gradient descent). The UI is tuned for operations storytelling and university presentations: dark blue / cyan theme, KPI cards, interactive Plotly analytics, and structured interpretation tabs.
Project description
A factory models total cost as:
[ f(x, y) = x^2 + y^2 - 4x - 6y + 13 ]
where x is labor hours and y is machine hours. The optimizer walks downhill on this surface using the analytic gradient until the gradient norm falls below a tolerance or an iteration limit is hit. The known optimum is x = 2, y = 3, with minimum cost 0.
Features
Modern dashboard layout with custom CSS (cards, hero header, metric grid, themed tabs).
Sidebar control panel: initial point, learning rate, max iterations, tolerance.
Input validation with clear success / warning / error messaging.
KPI cards: optimal x, optimal y, minimum cost, iteration count.
Iteration history table and Plotly charts: cost convergence, gradient norm, 2D contour with path, 3D surface, before vs after cost bar chart.
Business interpretation aligned with real planning language.
Educational tab with LaTeX-style algorithm summary.
Installation
pip install -r requirements.txt
Running the app
streamlit run app.py
Then open the local URL shown in the terminal (typically http://localhost:8501).
Screenshots
Placeholder: add your own screenshots after running the app.
Suggested captures:
Full dashboard with hero header and metric cards.
Optimization results tab with convergence plots.
Visualizations tab showing contour + 3D surface.
Sidebar with control panel.
Algorithm explanation
Objective: minimize (f(x,y)=x^2+y^2-4x-6y+13).
Gradient:
[ \frac{\partial f}{\partial x} = 2x - 4,\qquad \frac{\partial f}{\partial y} = 2y - 6 ]
Steepest descent update with learning rate (\eta > 0):
[ (x, y) \leftarrow (x, y) - \eta , \nabla f(x, y) ]
Stopping: terminate when (|\nabla f|_2 < \text{tolerance}) or when the maximum number of iterations is reached. Iteration logs (positions, cost, gradient norm) are stored for visualization and audit.
Business use case
Plant managers often negotiate staff hours and machine utilization under composite economic objectives. This demo treats (f) as a smooth surrogate for wage, energy, maintenance, and throughput penalties. After optimization, the app states the result in plain language, for example:
“The factory should use approximately X labor hours and Y machine hours to minimize production cost.”
The numerical solution can be checked against the analytical optimum (2, 3) to build trust in the method and parameter choices.
Technologies used
Stack Role
Python Core language
Streamlit Web UI / dashboard
NumPy Vector norms and numerics
Pandas Iteration history as tabular data
Plotly Interactive charts
Matplotlib Optional static contour helper