Supermarket sales
تفاصيل العمل
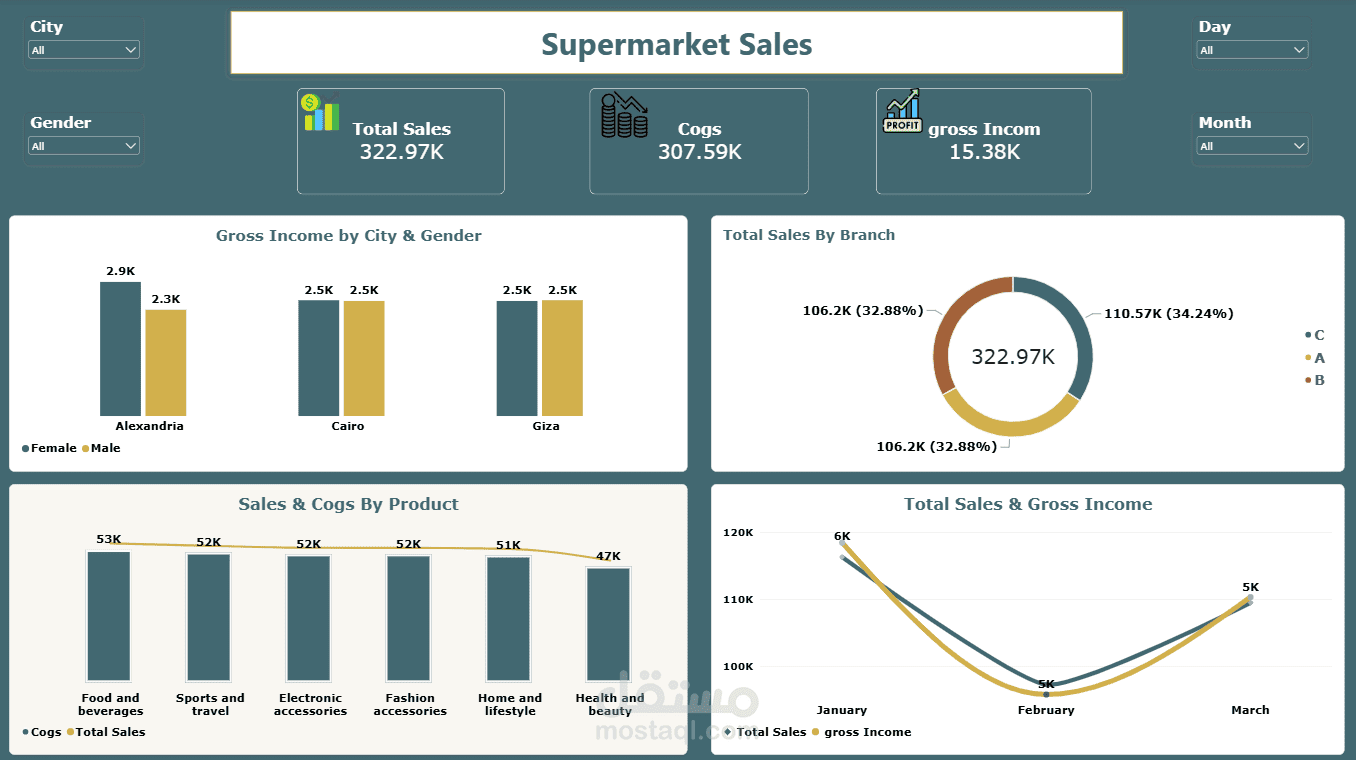
🛒 Supermarket Sales Performance &
Profitability Analysis
📌 Project Overview & Business Problem
Core Objective: Evaluate multi-branch supermarket sales performance, product line profitability, and supply chain cost pressures to maximize net margins.
Business Scope: Comprehensive end-to-end retail data analysis across branches in Alexandria, Cairo, and Giza utilizing Power BI and Power Query for deep financial and operational insights.
📊 Dashboard Preview
Dashboard
🎯 Executive Summary & Strategic Insights
Financial Pressure & Margins:
High vendor costs inflate overall Cost of Goods Sold (COGS) to ~95%, leaving a tight net profit margin of 4.8%.
Health & Beauty operates at a net loss (negative margin) as its COGS consistently exceeds total sales revenue.
Operational & Supply Chain Discrepancies:
Significant COGS variances exist for identical product categories across the three branches (Alexandria, Cairo, Giza).
This points directly toward decentralized procurement, inconsistent localized supplier pricing, or varying delivery terms across regions.
Seasonal Trends (February Dip):
A sharp, sudden decline in gross income and sales occurred across all major product lines during February.
Performance fully recovered in March, indicating seasonal demand shifts or operational calendar differences.
💡 Key Analytical Findings & Breakdown
1. Commercial Performance & Product Margins
Top Revenue Drivers: Food & Beverages and Sports & Travel lead overall sales performance and top-line revenue.
Loss-Making Categories: Health & Beauty generates the lowest sales while facing critical cost pressures leading to negative profit margins.
2. Branch & Regional Execution
Branch Distribution: Sales volume is evenly distributed across branches (~32% to 34% share each).
Demographic Performance: Alexandria shows higher gross income contribution among female customers compared to male customers, while Cairo and Giza maintain demographic parity.
### 3. Monthly Sales Performance
Sales Volatility: Total sales dropped to ~95K during February before rebounding strongly to ~110K in March.
🛠️ Tools & Technologies Used
Power BI: Advanced DAX measures, data modeling, and interactive dashboard design.
Power Query: ETL processes, data cleaning, and transformation.
GitHub: Version control and professional project documentation.
🚀 Strategic Recommendations & Action Plan
Centralize Procurement: Consolidate purchasing across branches to renegotiate unified vendor contracts and lower overall COGS.
Optimize Pricing Strategy: Adjust retail selling prices upwards on low-margin products to absorb increasing cost pressures.
Inventory & Category Rationalization: Reduce stock levels or discontinue unprofitable items within the Health & Beauty category to prevent ongoing margin erosion.
Seasonal Campaign Planning: Introduce targeted promotions during slow periods (like February) to maintain steady cash flow and sales momentum.