Amazon Cancelled Orders
تفاصيل العمل
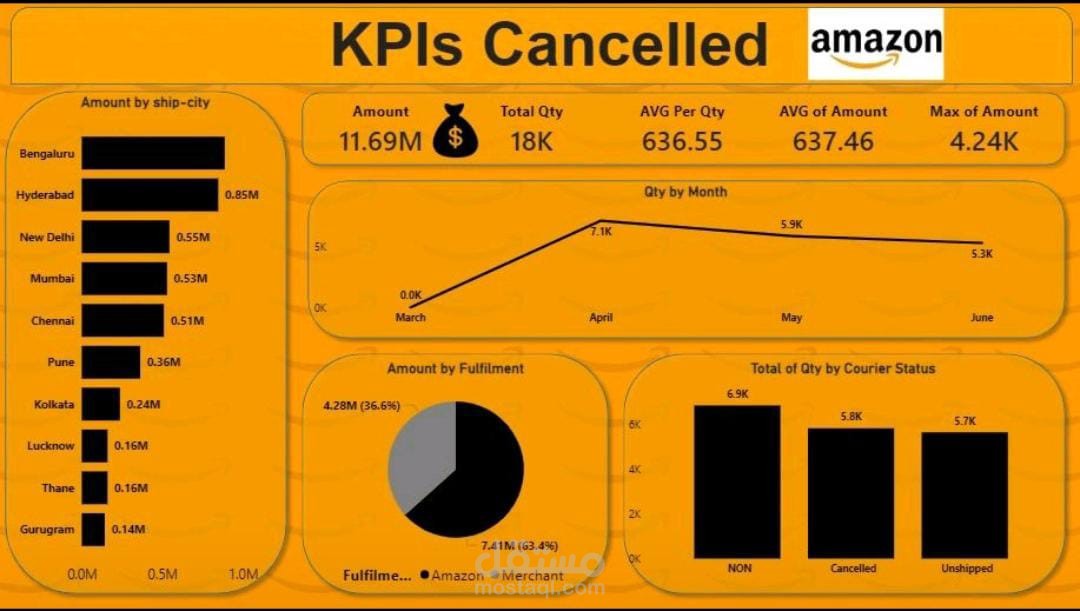
Amazon Cancelled Orders – KPI Dashboard
I'm excited to share a data visualization project focused on analyzing cancelled orders and uncovering actionable insights to improve operational performance.
🔍 Key Highlights:
💰 Total Cancelled Amount: $11.69M
📦 Total Quantity: 18K orders
📊 Avg. Order Value: $637
🚀 Max Order Value: $4.24K
📈 Trend Analysis:
Significant growth in April (7.1K orders) followed by a gradual decline through June
Major cities like Bengaluru and Hyderabad contribute the highest share of cancelled order value
🚚 Fulfillment Insights:
63.4% of orders handled by Amazon fulfillment
Courier status shows:
Highest in Non-delivered
Followed by Cancelled
Then Unshipped
💡 Objective: This dashboard aims to provide clear visibility into cancellation patterns to:
Reduce order cancellations
Optimize logistics and delivery performance
Enable data-driven decision making
🛠️ Tools Used: Power BI | Data Analysis | Data Visualization