Bike-Sharing User Behavior Analysis
تفاصيل العمل
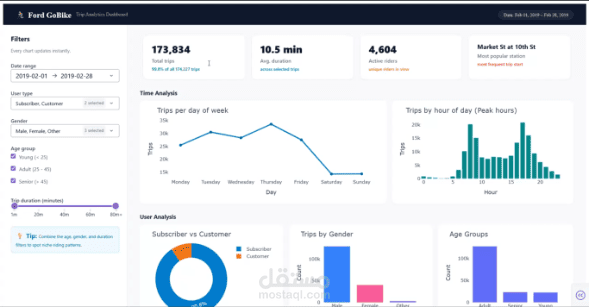
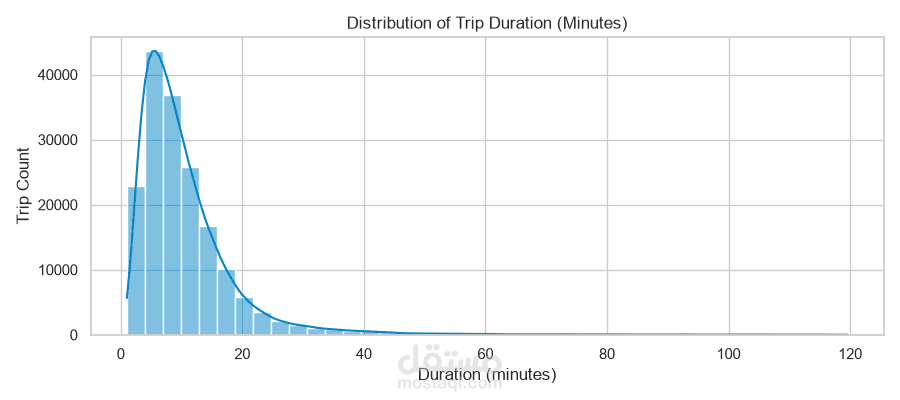
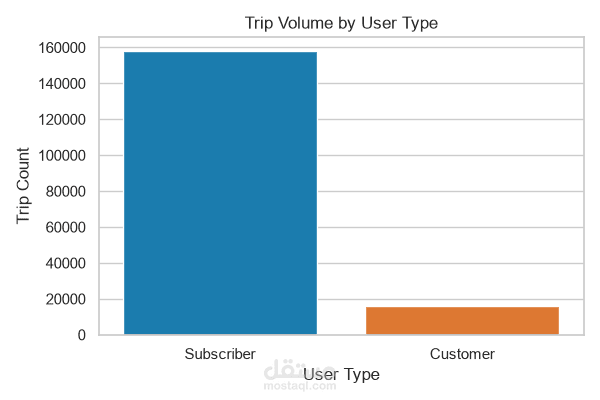
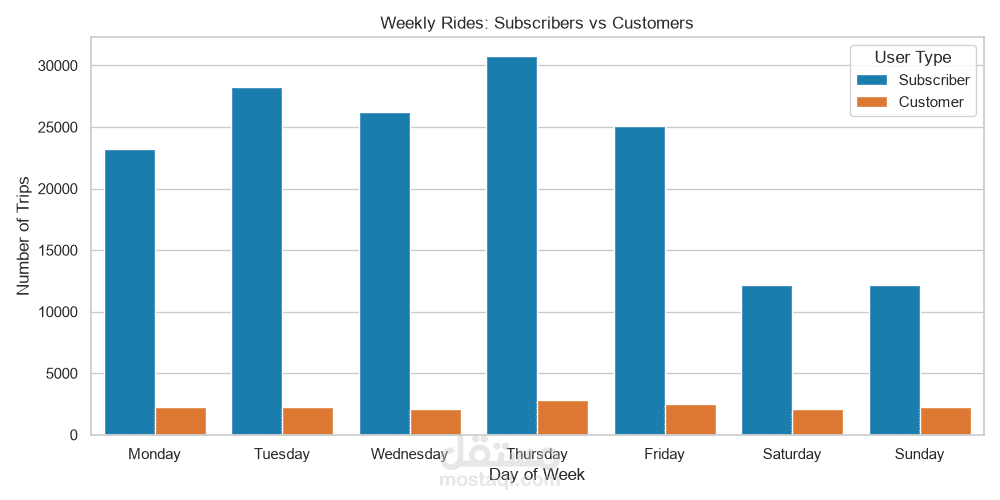
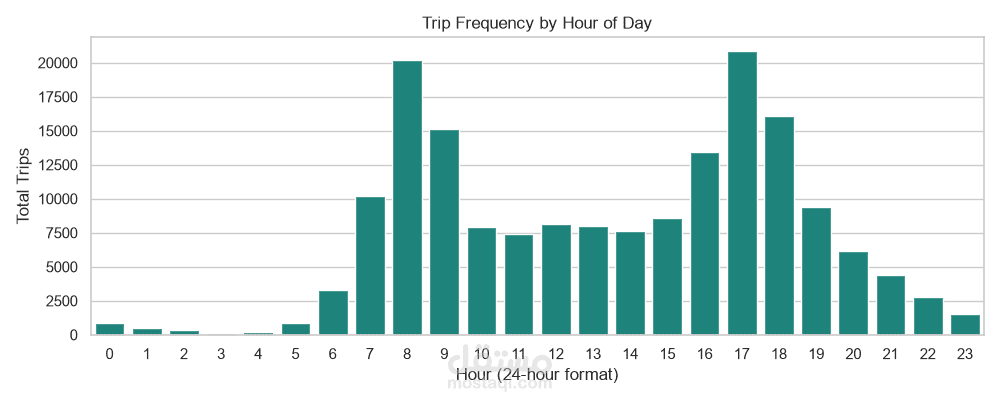
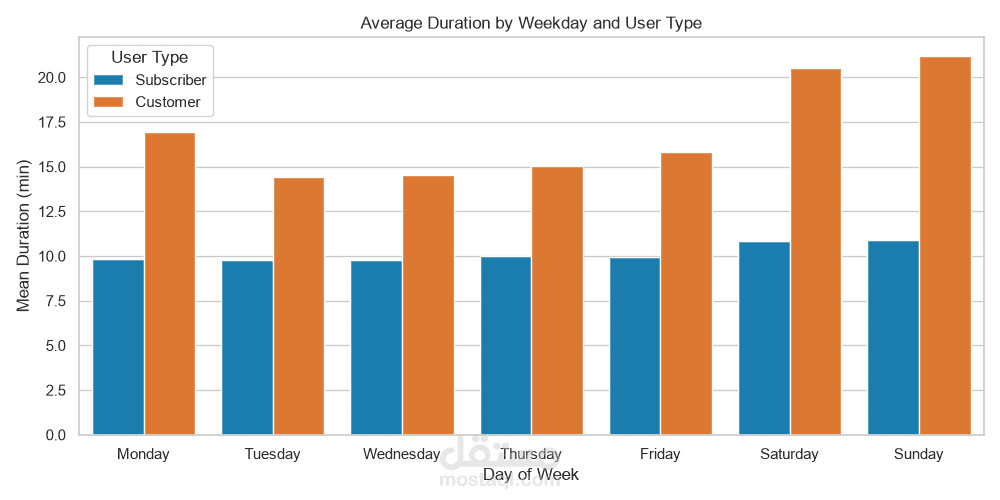
Project OverviewThis project delivers a comprehensive, end-to-end data intelligence solution transforming raw urban bike-sharing transactional data into actionable business and operational insights. The workflow encompasses automated data preprocessing and feature engineering, a PostgreSQL star-schema data warehouse, exploratory data analysis (EDA), and a high-performance interactive web dashboard built with Python. Key Features & DeliverablesAutomated Data Cleaning & Feature Engineering (preprocessing.py):Automated pipeline handling missing values, filtering out extreme outliers (unrealistic rider ages and trip durations), and standardizing data types. Engineered critical features including calculated trip duration in minutes, weekday identifiers, weekend flags, age demographics (Young, Adult, Senior), and route definitions. PostgreSQL Data Warehouse Design (postgresql_database_schema.sql):Designed and implemented an optimized Star Schema ERD consisting of three dimension tables (dim_time, dim_station, dim_user) and a centralized fact table (fact_trips). Implemented primary keys, foreign key constraints, and strategic B-tree indexes to accelerate complex analytical queries across high-volume dataset records. Exploratory Data Analysis (exploratory_data_analysis.py):Performed univariate, bivariate, and multivariate exploratory analyses using Matplotlib and Seaborn. Visualized trip distributions, user demographics, hourly usage peaks, and subscriber vs. customer behavioral patterns. Interactive Web Analytics Dashboard (interactive_dashboard_application.py):Built a full-screen, responsive web dashboard using Dash and Plotly Express. Integrated real-time KPI overview cards (Total Trips, Average Duration, Active Riders, Top Departure Station). Implemented dynamic multi-filtering capabilities: Date Range Picker, User Type, Gender, Age Group, and Trip Duration slider controls. Key Business Insights ExtractedUser Retention & Revenue Base: Subscribers account for over 85% of total system rides, representing the core recurring revenue stream and daily operational backbone. Commuter vs. Leisure Segments: Subscriber trips peak sharply on Monday–Friday during traditional commute windows (8:00–9:00 AM and 5:00–6:00 PM), while casual Customers ride consistently throughout the week with increased leisure engagement on weekends. Trip Duration Behavior: Casual Customers average significantly longer rides (15–20 minutes) compared to Subscribers (10–12 minutes), pointing toward distinct pricing and membership optimization opportunities.