Traffic Data Analysis and Reporting Using Microsoft Excel
تفاصيل العمل
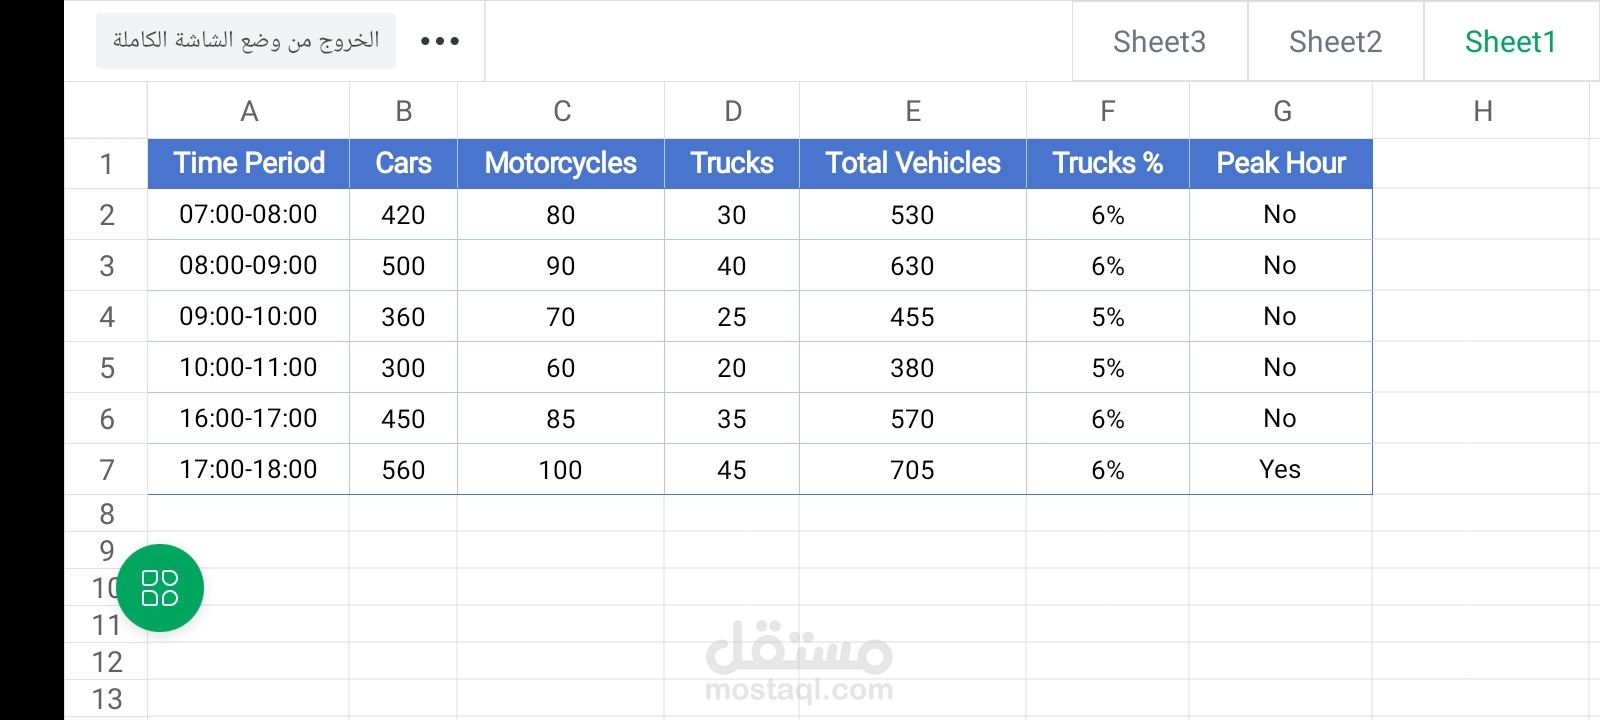
This project demonstrates traffic data analysis and reporting using Microsoft Excel. It organizes traffic data into structured tables, applies formulas to calculate key indicators, and presents the results through clear summaries and charts.
The workbook is designed to help analyze traffic volumes, compare traffic counts across different periods or locations, identify trends, and support data-driven transportation planning.
Tools: Microsoft Excel
Note: This is a sample portfolio project intended to demonstrate data analysis and reporting skills.