Call Center Performance & Customer Sentiment Analysis Dashboard | Excel
تفاصيل العمل
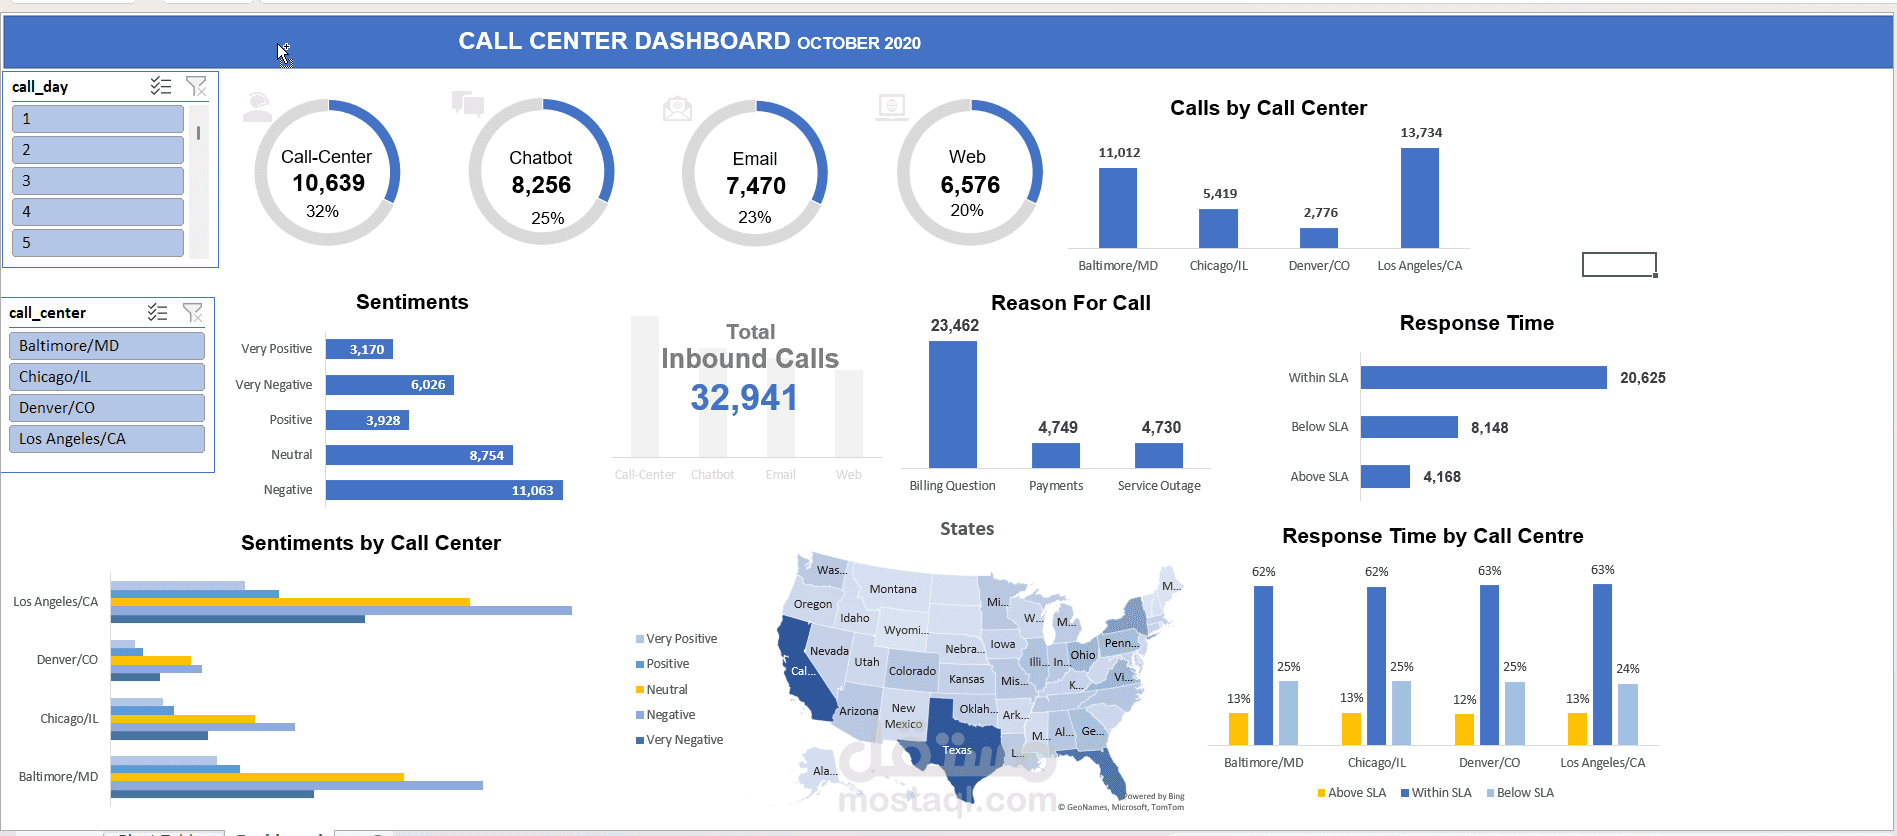
Developed an interactive Call Center Analytics Dashboard using Microsoft Excel to monitor call center performance, analyze customer sentiment, and evaluate response times.
The dashboard includes:
- **Call Volume Analysis:** Tracking total inbound calls and comparing communication channels, including call center, chatbot, email, and web.
- **Call Center Performance:** Comparing call volumes across different locations and identifying performance trends.
- **Customer Sentiment Analysis:** Analyzing very positive, positive, neutral, negative, and very negative customer feedback.
- **Call Reason Analysis:** Identifying the most common reasons for customer inquiries, including billing questions, payments, and service outages.
- **Response Time Monitoring:** Evaluating service-level agreement (SLA) performance by tracking responses within, below, and above SLA.
- **Geographical Analysis:** Visualizing call center activity across different locations and states.
- **Interactive Filtering:** Exploring data by call date and call center location.
The dashboard transforms call center data into actionable insights to help monitor service quality, understand customer satisfaction, and identify opportunities to improve operational efficiency.
**Tools Used:** Microsoft Excel, Pivot Tables, Pivot Charts, Data Analysis, and Data Visualization.