E-commerce Analytics in Excel
تفاصيل العمل

Business Problem
A fashion e-commerce store (TheLook) had orders, customers, products, inventory and web-event data spread across separate tables. The goal was to turn the raw data into one interactive view of sales performance, plus a forward-looking revenue forecast — using Excel only.
My Approach
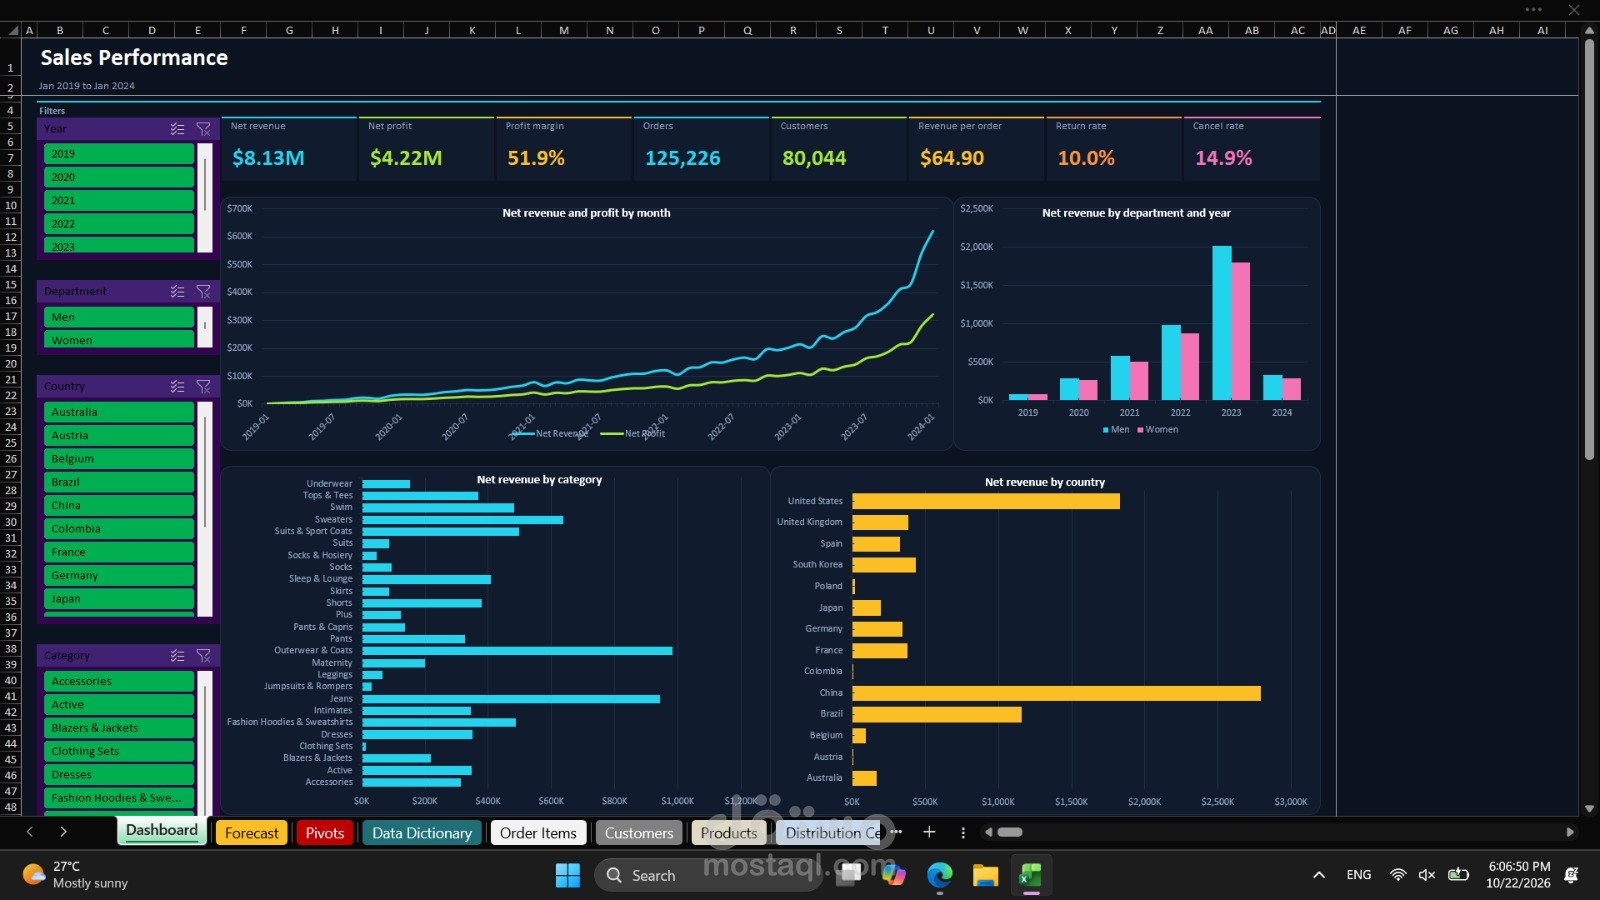
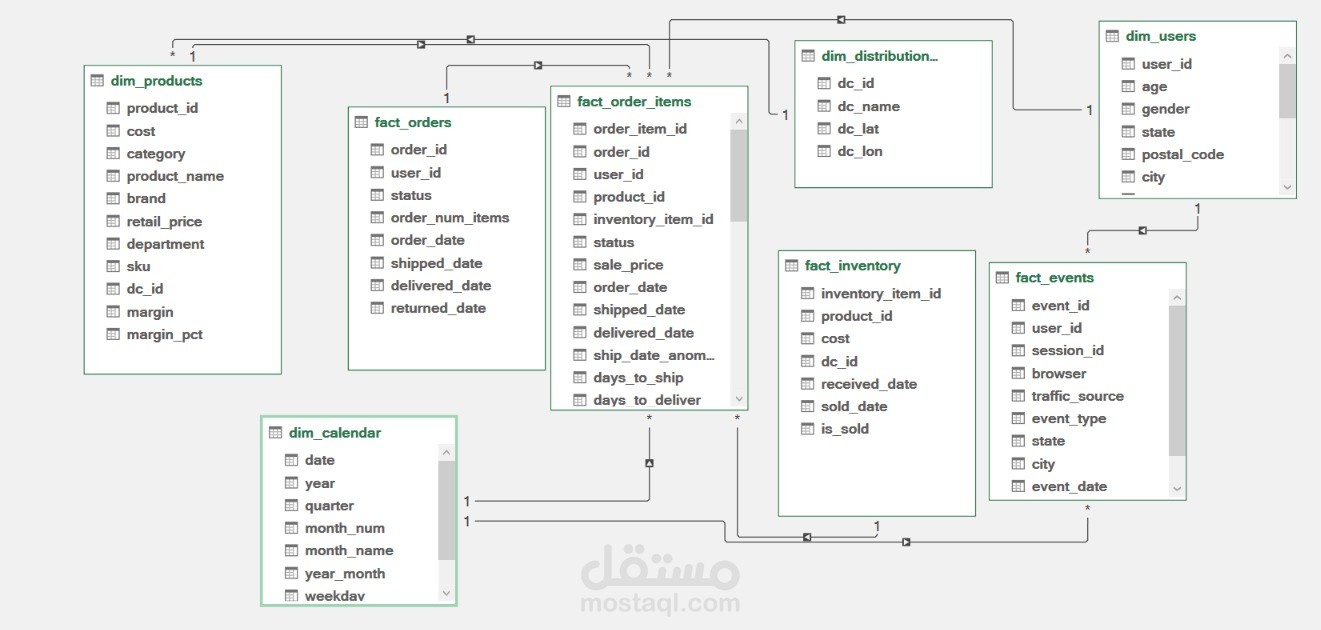
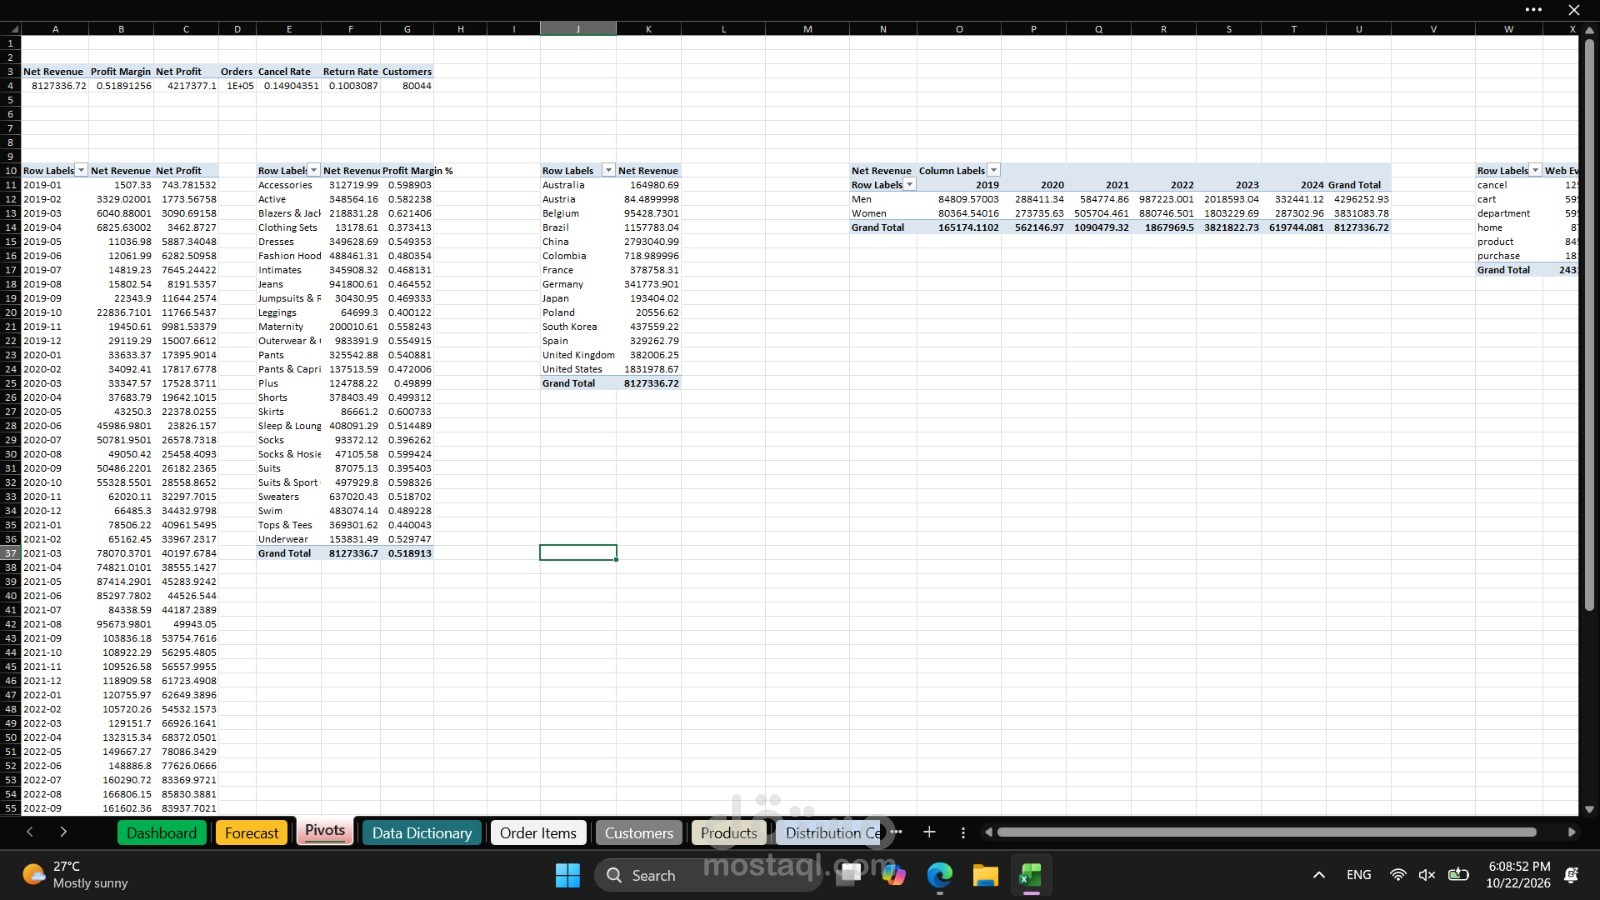
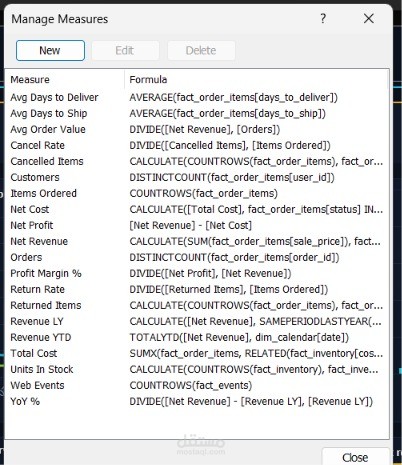
Cleaned and prepared the raw data with Power Query, then built an 8-table data model (fact_orders, fact_order_items, fact_inventory, fact_events and the dim_products, dim_users, dim_calendar, dim_distribution_centers tables) with proper relationships. Wrote 20 DAX measures for Net Revenue, Net Profit, Profit Margin, Orders, Customers, Return Rate, Cancel Rate, YoY %, Revenue YTD and more. Built an interactive dashboard with Pivot Tables and Slicers for Year, Department, Country and Category, and documented every table and field in a Data Dictionary.
Key Findings
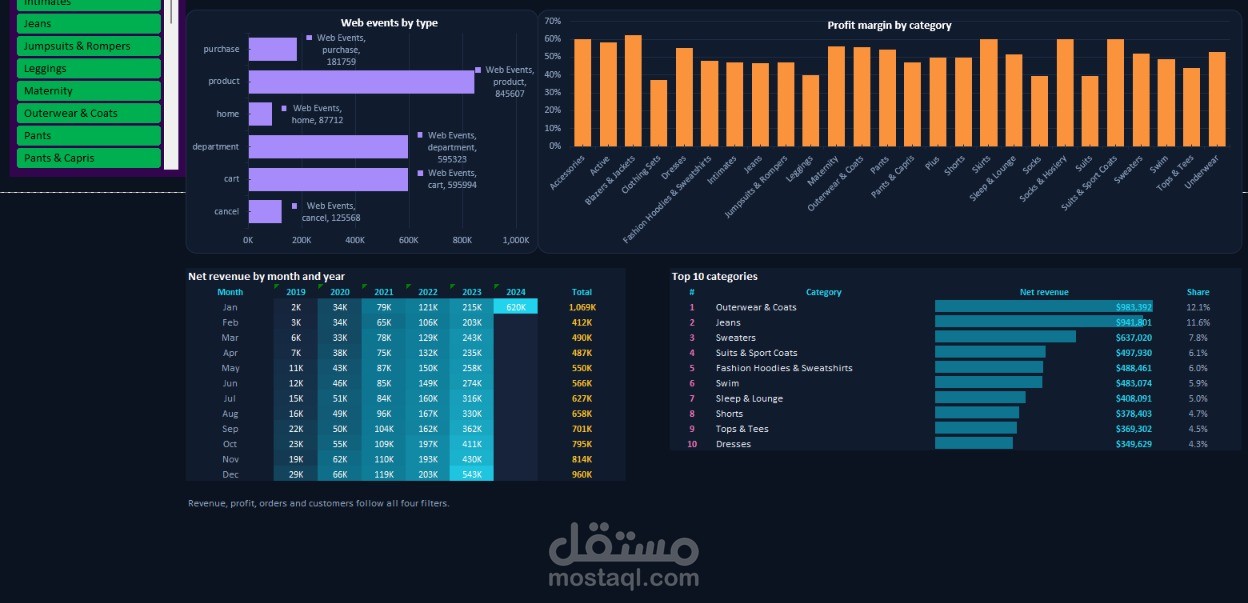
The store tracked $8.13M net revenue across 125,226 orders and 80,044 customers, with a 51.9% profit margin, $64.90 revenue per order, a 10.0% return rate and a 14.9% cancel rate. Revenue grew sharply year over year, peaking at about $3.8M in 2023. Outerwear & Coats ($983K) and Jeans ($941K) were the top categories, together about 24% of revenue. China ($2.79M) and the United States ($1.83M) led by country. Web events showed 845K product views against 182K purchases, a clear funnel drop-off.
Revenue Forecast
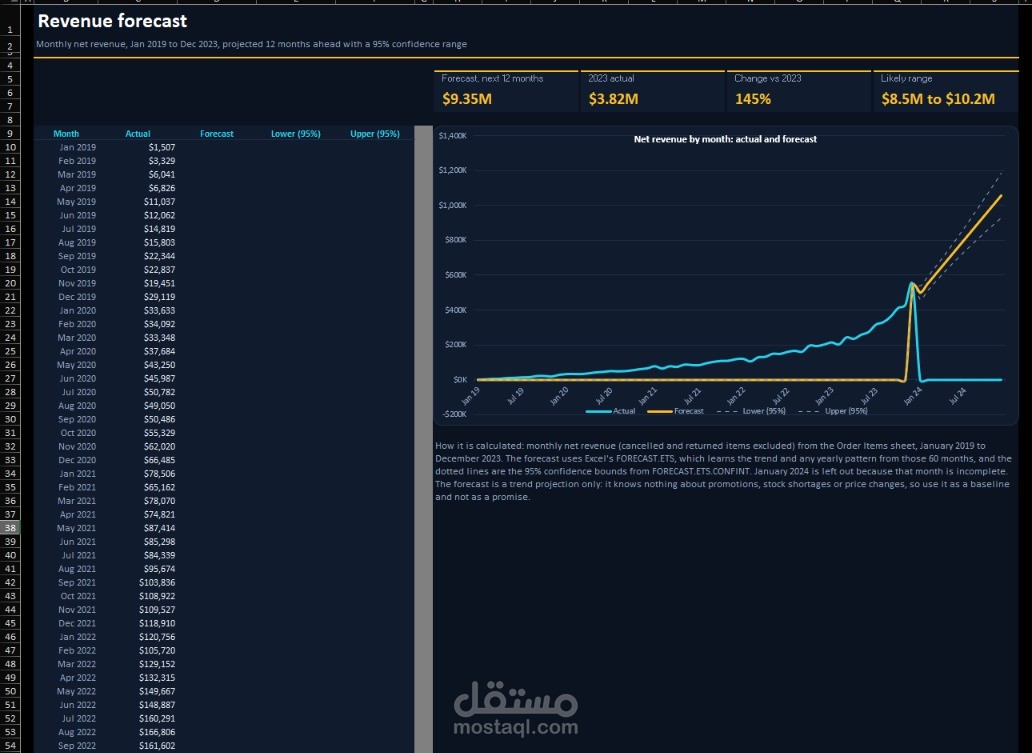
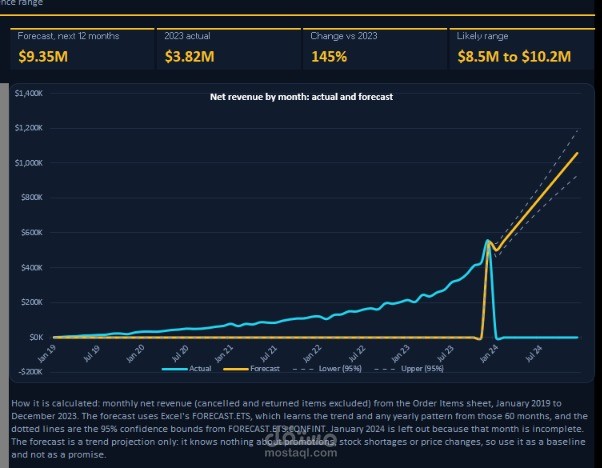
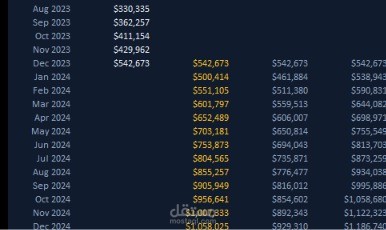
Used Excel's FORECAST.ETS with a 95% confidence range (FORECAST.ETS.CONFINT) on 60 months of net revenue to project the next 12 months at about $9.35M (likely range $8.5M to $10.2M). It is a trend baseline only; it does not account for promotions, stock shortages or price changes.
Impact
Delivered a complete Excel workflow from raw data to an interactive analysis that supports decisions on categories, markets and returns, with documentation that makes it easy for others to extend.