Superstore Management Dashboard | Excel Data Analysis
تفاصيل العمل
Project Overview
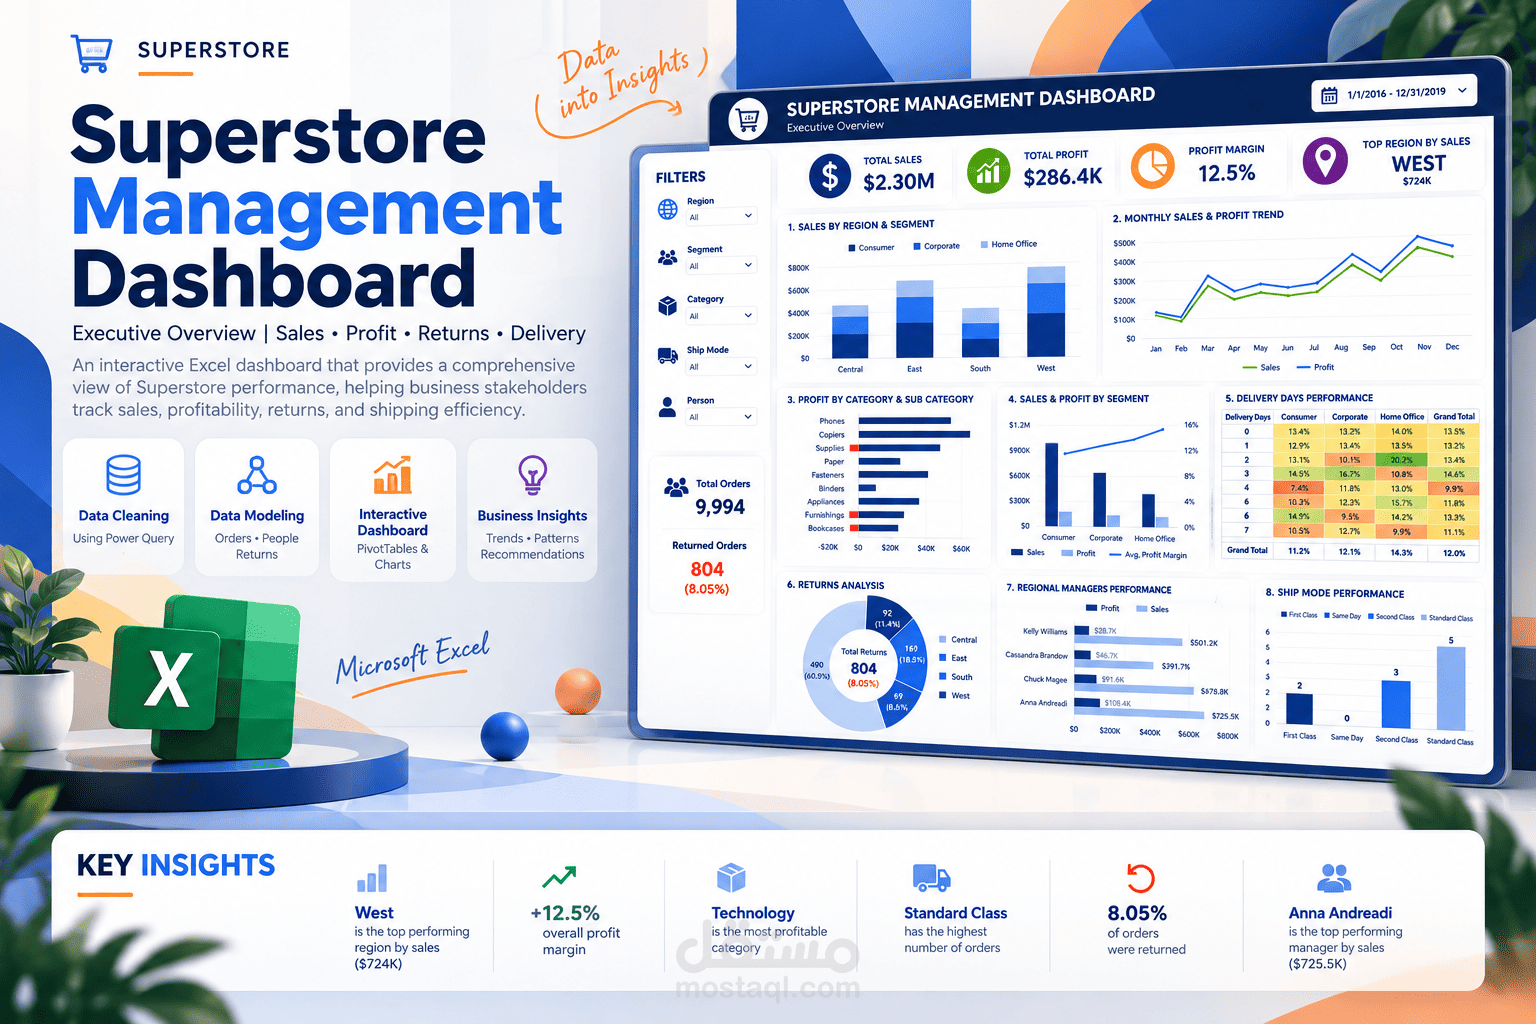
Designed and developed an interactive Superstore Management Dashboard using Microsoft Excel to analyze sales, profitability, customer segments, returns, delivery performance, and regional manager performance from 2016 to 2019.
Data Preparation and Cleaning
Worked with three source tables: Orders, People, and Returns. Used Power Query to correct data types, clean text values, remove blank rows and duplicates where appropriate, handle date-format issues, and prepare the data for analysis.
Created three calculated fields: Sales Category, Profit Margin, and Delivery Days.
Data Modeling with Power Pivot
Connected the Orders, People, and Returns tables through the Excel Data Model. Created relationships using Region and Order ID, enabling cross-table analysis through PivotTables.
Analytical Layer: 9 PivotTables
Created 9 PivotTables covering:
1. Sales by Region and Customer Segment.
2. Profit by Category and Sub-Category.
3. Monthly Sales and Profit Trends.
4. Sales by State.
5. Profit Margin by Delivery Days and Segment.
6. Returned Orders by Region.
7. Sales and Profit by Regional Manager.
8. Sales, Profit, and Profit Margin by Customer Segment.
9. Average Delivery Days by Shipping Mode.
Dashboard Design and Interactivity
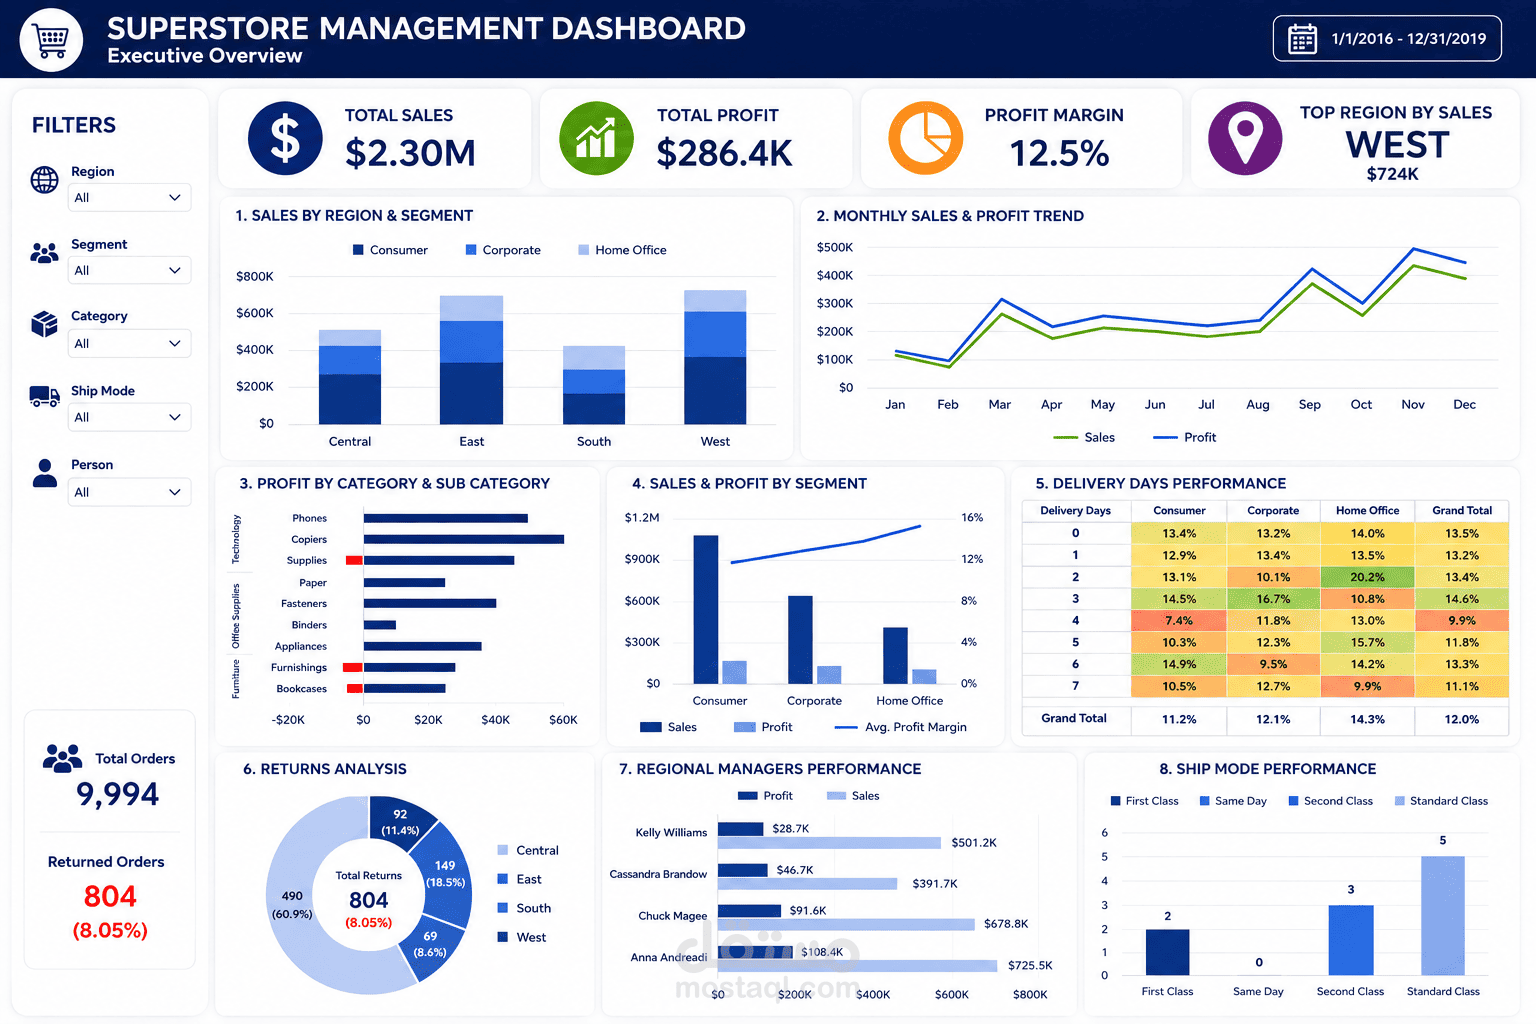
Designed a custom executive dashboard with a navy-blue header, organized filter panel, consistent typography, KPI cards, and a structured visual layout.
The dashboard includes 4 primary KPI cards showing Total Sales, Total Profit, Profit Margin, and Top Region by Sales.
Added 5 interactive slicers for Region, Segment, Category, Ship Mode, and Person, allowing users to filter and explore the dashboard.
Included a summary of Total Orders, Returned Orders, and Return Rate, along with 8 main visual components covering regional sales, monthly trends, product profitability, segment performance, delivery-day analysis, returns, manager performance, and shipping modes.
Tools Used
Microsoft Excel, Power Query, Power Pivot, Excel Data Model, PivotTables, Excel Formulas, Interactive Slicers, KPI Cards, Conditional Formatting, and Data Visualization.
Project Outcome
Delivered an interactive Excel dashboard that consolidates sales, profitability, returns, shipping performance, and regional manager metrics into one executive reporting solution.