Global LNG Shipping Performance (2020–2024) | Excel Dashboard
تفاصيل العمل
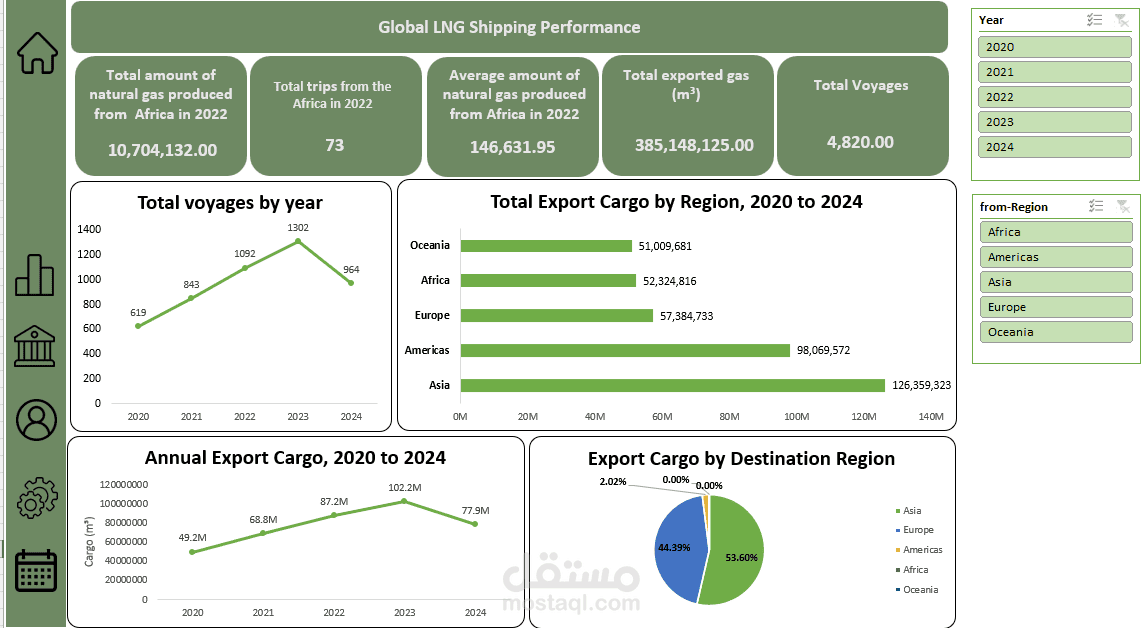
I analyzed 4,820 LNG (liquefied natural gas) shipping voyages between export and import terminals worldwide from 2020 to 2024, and built an interactive Excel dashboard showing exported volumes by region and year, voyage counts, and average cargo size.
Problem:
The raw data had missing cargo amounts, placeholder distances, inconsistent dates, and duplicate country names written in different formats.
Solution:
- Cleaned the data, excluded voyages with missing amounts, and separated export voyages from return (empty) voyages.
- Linked the voyages table to a terminals reference table (545 terminals) using XLOOKUP.
- Replaced placeholder distances with the average distance for the same region pair.
- Summarized the data with Pivot Tables and built KPIs and interactive slicers.
Result:
A dashboard showing total exported gas (about 385 million m³), a regional ranking led by Asia (about 126 million m³), and the yearly export trend.
Tools: Excel (Tables, XLOOKUP, Pivot Tables, Slicers, DSUM/DCOUNT, Charts).