Interactive Sales & Performance Dashboard | Power BI | Dark Theme UI
تفاصيل العمل
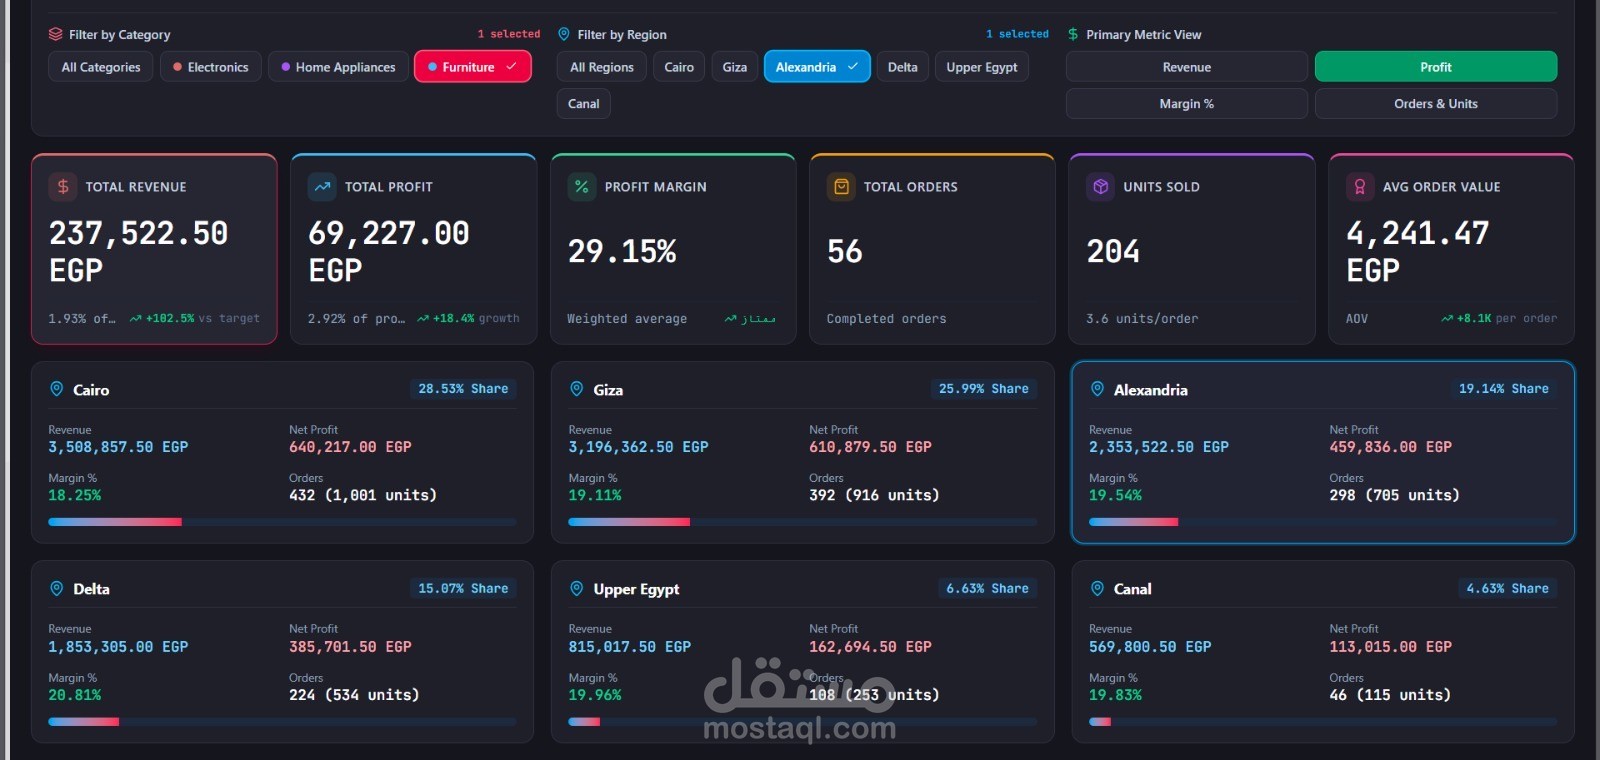
Stop guessing. Start making decisions based on clear, actionable data.
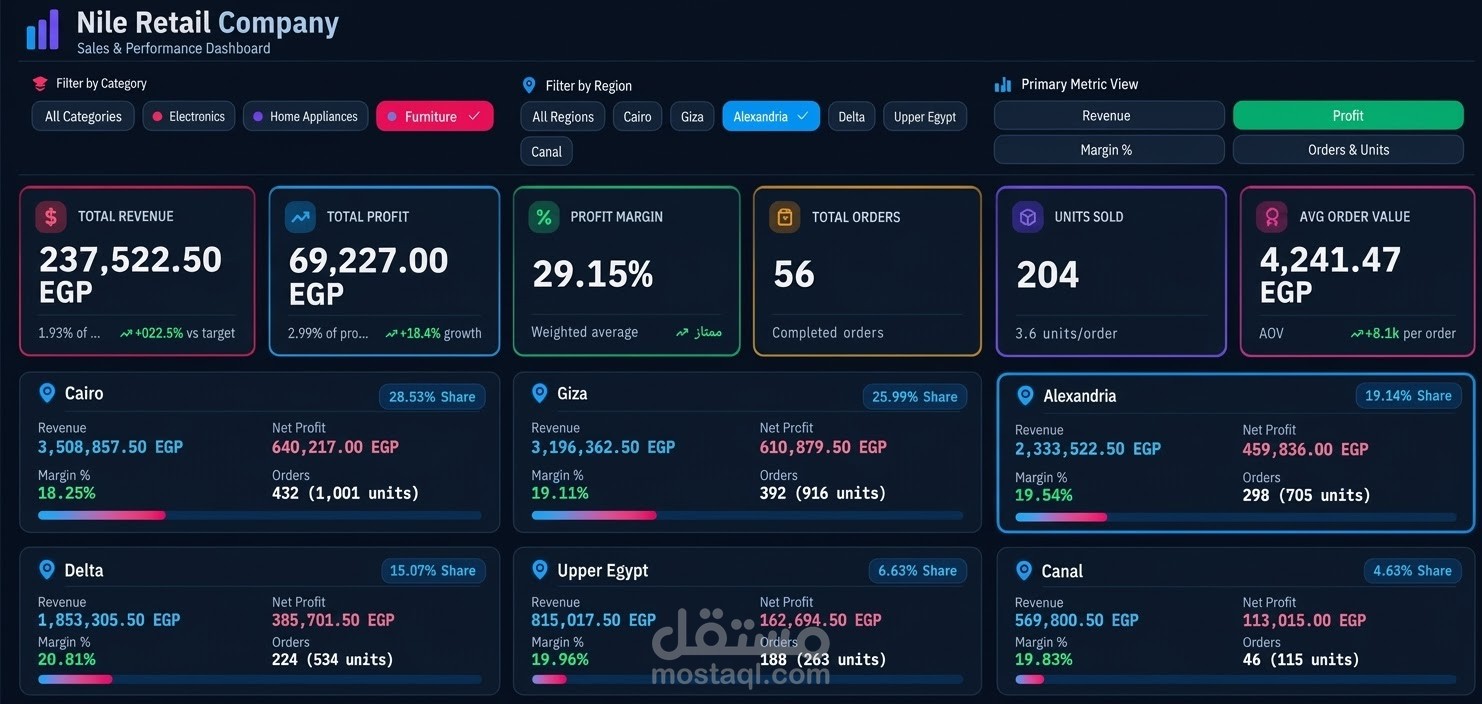
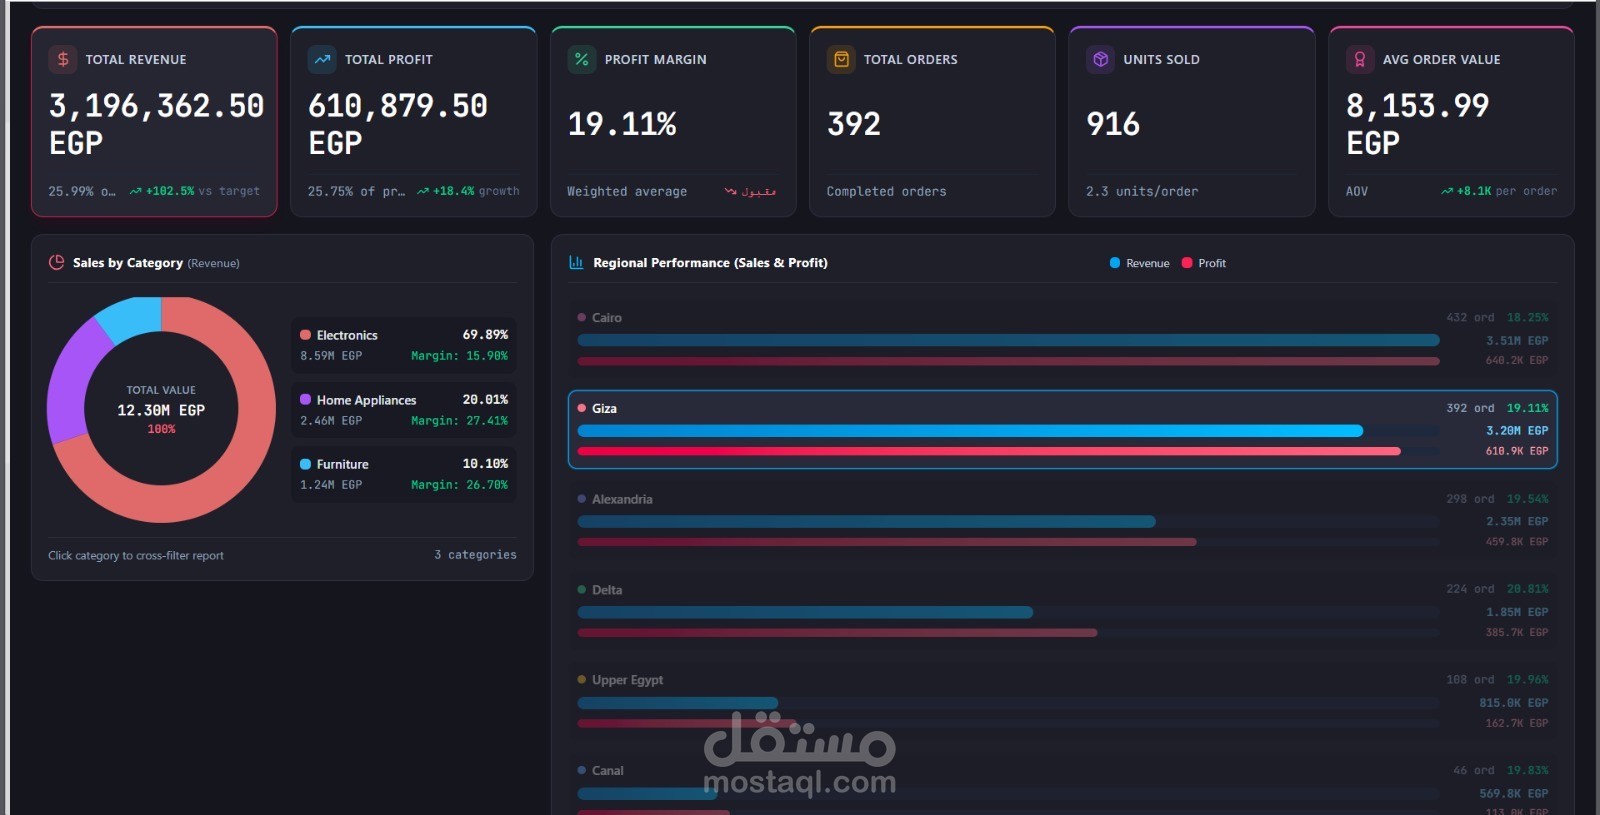
If your business data is scattered across spreadsheets, this custom-built dashboard is exactly what you need. I designed this Nile Retail Company dashboard to transform complex sales data into a single, easy-to-read view.
What this dashboard delivers for your business:
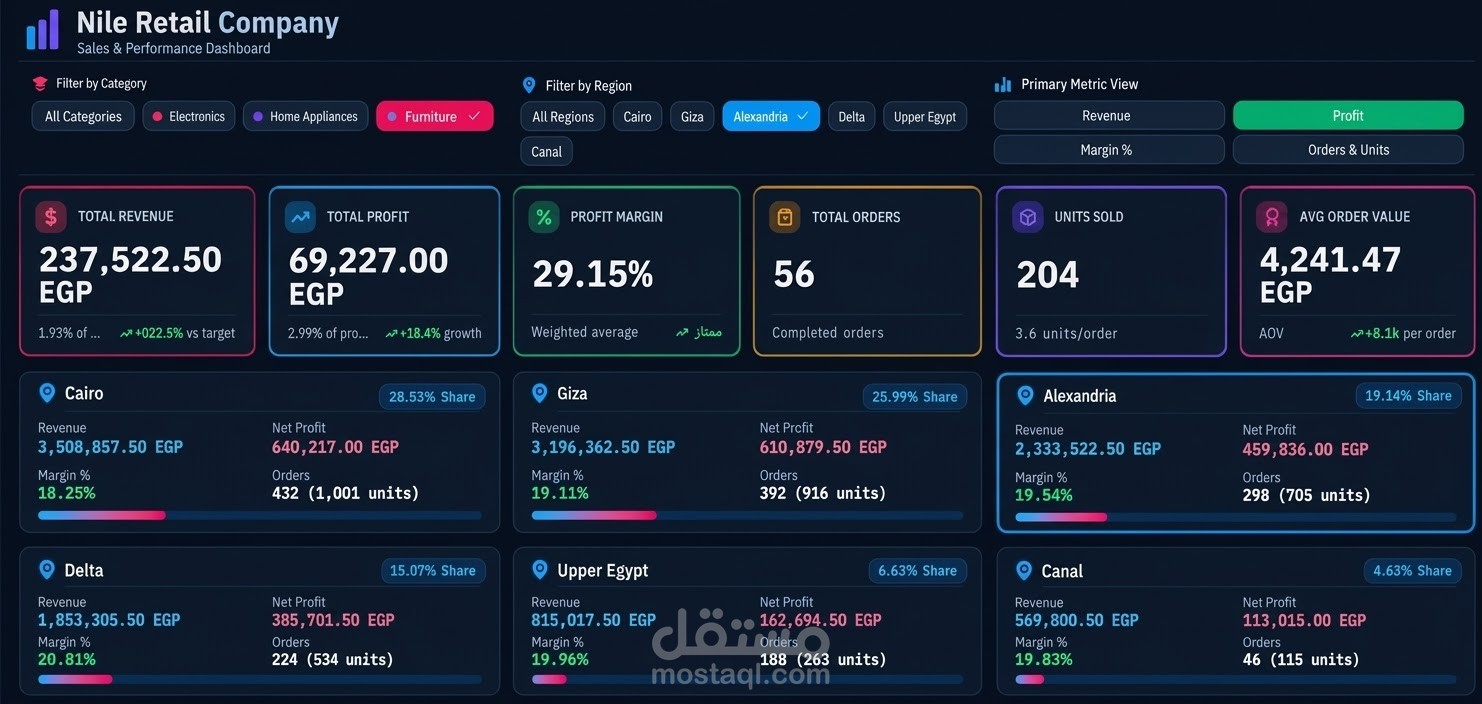
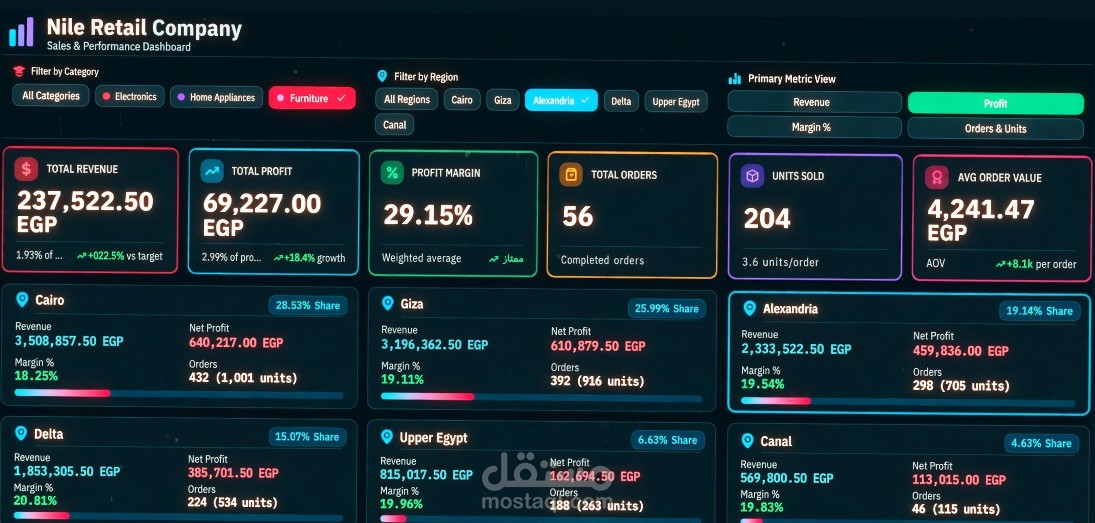
• Instant Clarity: All your critical KPIs (Total Revenue, Profit, Margin, Orders, AOV) are front and center. No more digging through numbers.
• Deep Regional Insights: Instantly compare revenue and profit across different regions (Cairo, Giza, Alexandria, etc.) to see exactly where your business is winning.
• Smart Filtering: One click on the category or region filters updates all charts and KPIs instantly.
• Product Breakdown: A clean, interactive Donut Chart shows you exactly which categories drive your revenue and which ones have the best margins.
• Modern Dark UI: A clean, high-contrast dark theme designed to reduce eye strain and make the data pop.
Skills used: Power BI, DAX, Data Modeling, Interactive UI Design.
Got a specific dataset? I can replicate this exact clean style and logic for your own company’s data. Message me with your requirements, and let's turn your data into your next big advantage.