Interactive Restaurant Sales Dashboard & Performance Analysis
تفاصيل العمل
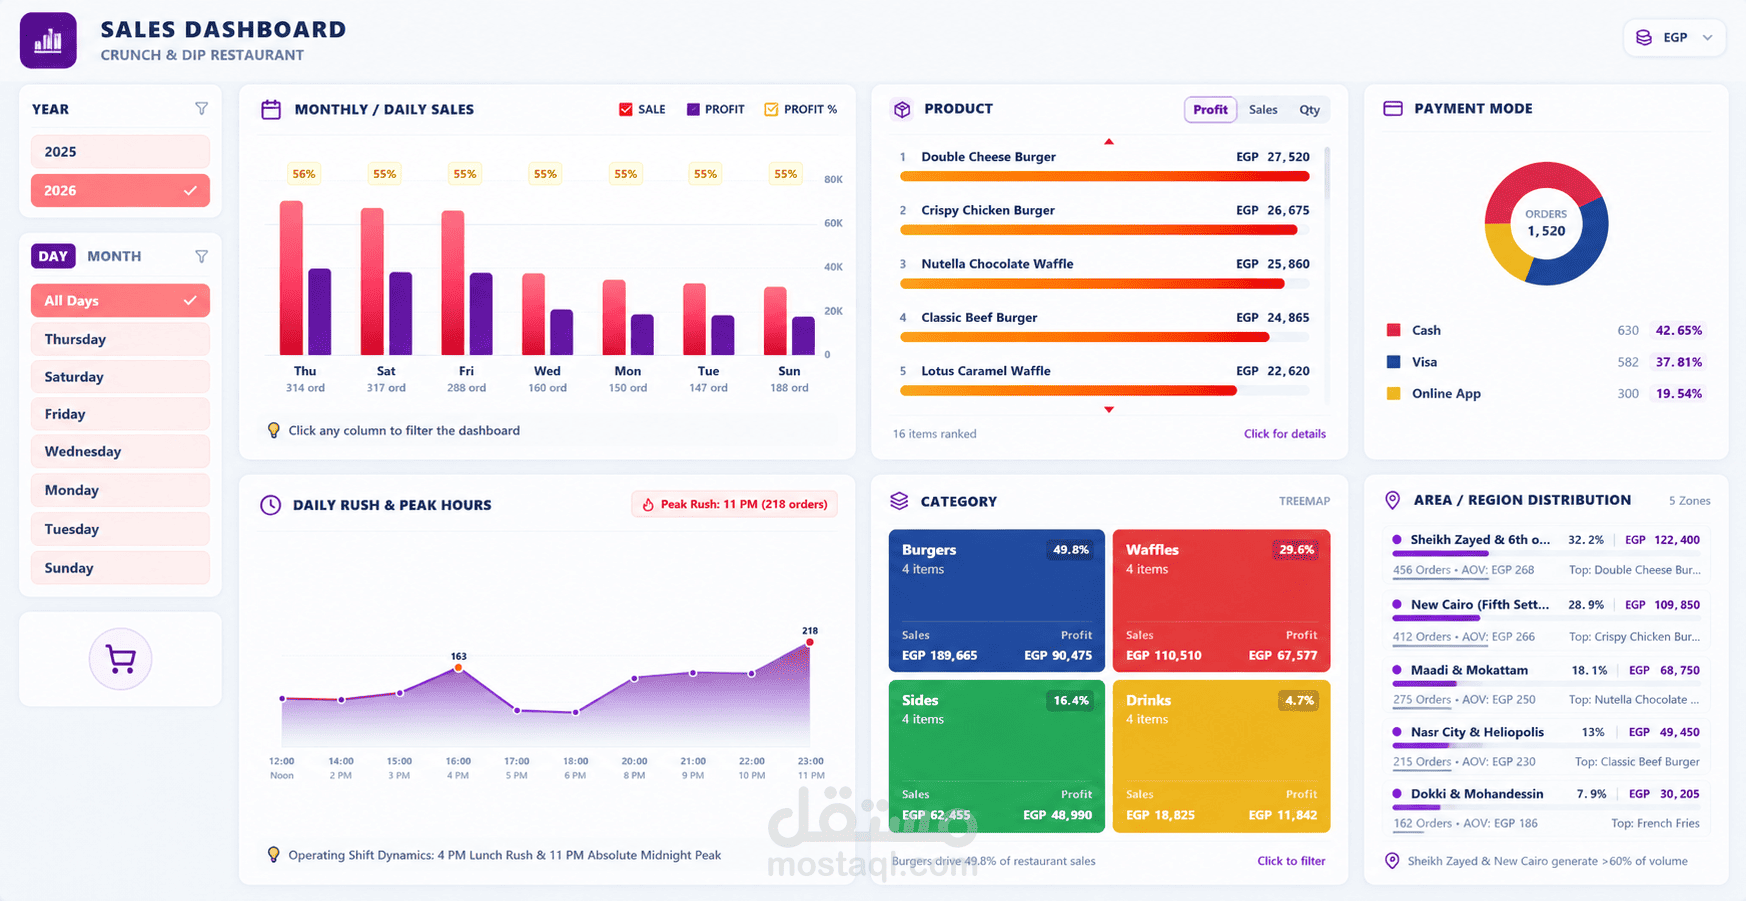
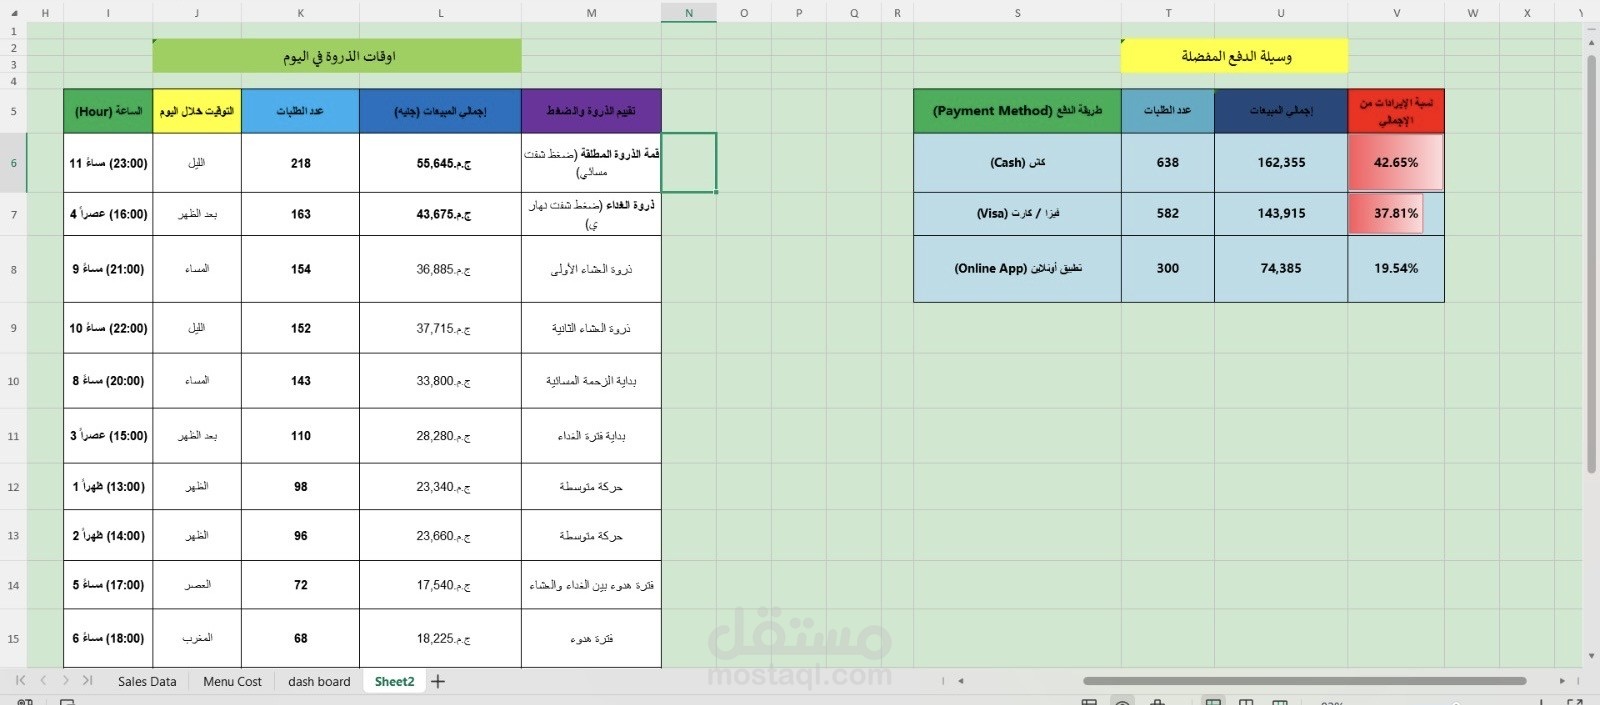
Developed an interactive restaurant sales dashboard to analyze business performance, monitor key performance indicators (KPIs), and identify sales trends.
Key Features:
* Monthly and daily sales and profit analysis.
* Top-selling products ranked by sales and profit.
* Payment method analysis, including Cash, Visa, and Online App.
* Peak hours and customer order trends.
* Sales and profit analysis by product category.
* Regional sales performance and order distribution.
* Interactive filters for years and days to explore the data.
Project Objective:
To transform restaurant sales data into clear, actionable insights that help business owners understand performance, identify profitable products, and make data-driven decisions.
Tools: Data Analysis, Dashboard Design, Data Visualization