Superstore Retail Sales & Profit Analytics Dashboard
تفاصيل العمل
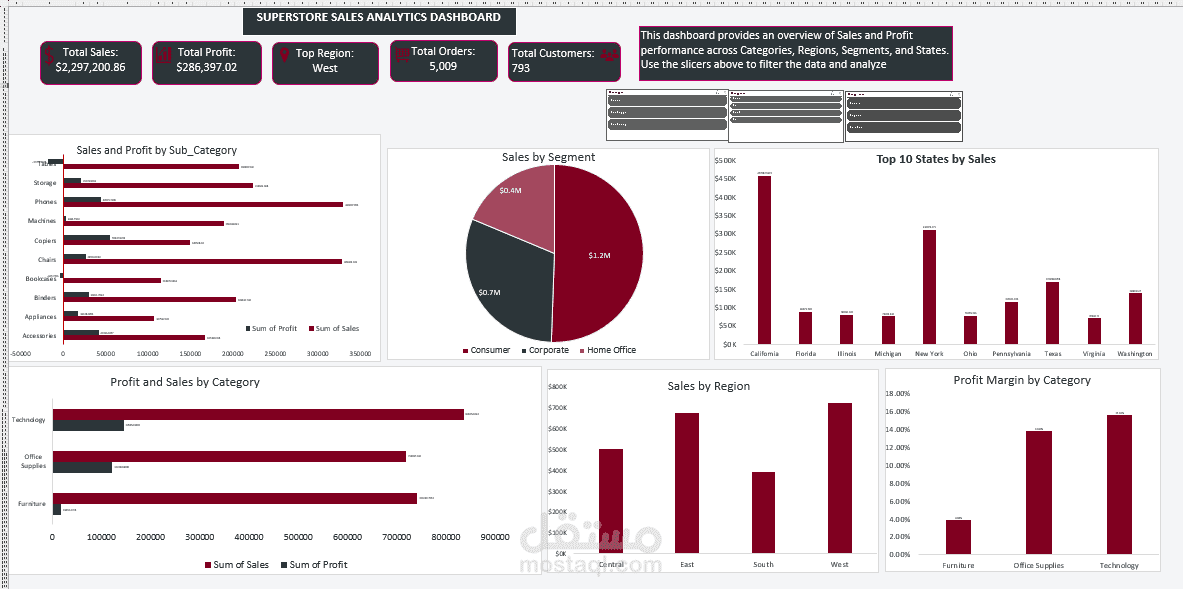
Executive Overview:
Developed a comprehensive Retail Sales & Profit Analytics Dashboard designed to evaluate retail store performance across product categories, customer segments, and geographical regions to optimize profitability and identify key revenue drivers.
Key Performance Indicators & Visual Insights:
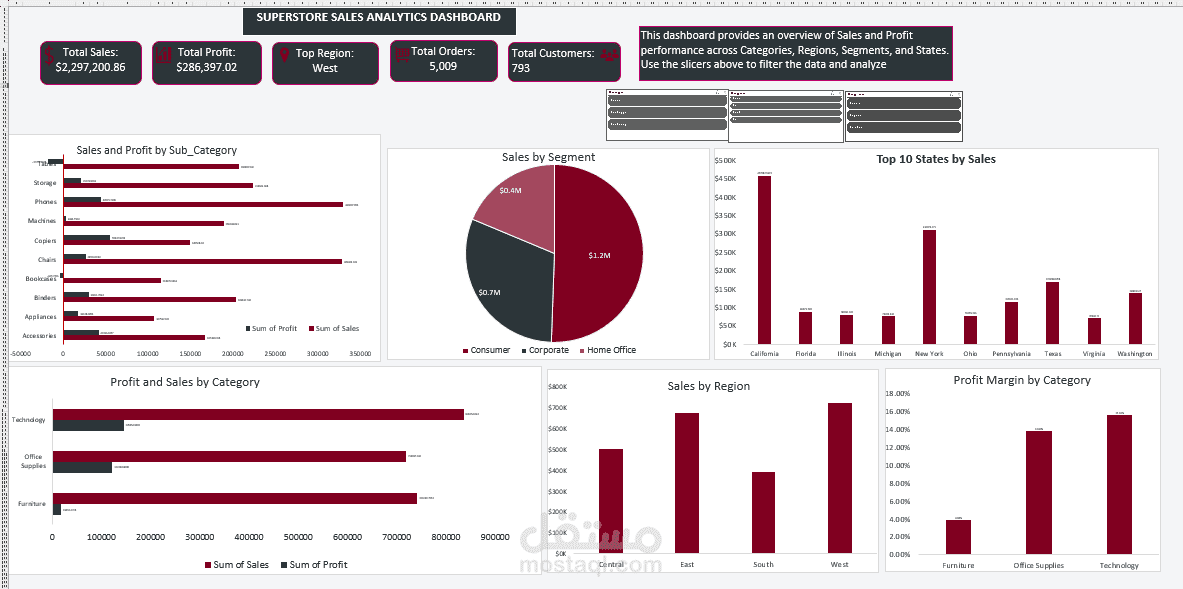
Executive Metrics Cards (KPIs): Instant display of Total Sales ($2.30M), Total Profit ($286.40K), Top Performing Region (West), Total Orders (5,009), and Total Customers (793).
Category & Sub-Category Performance: Comparative horizontal bar charts analyzing Sales vs. Profit across primary categories (Technology, Office Supplies, Furniture) and sub-categories (Phones, Chairs, Storage, Copiers).
Customer Segment Breakdown: Pie chart visualizing market share across Consumer ($1.2M), Corporate ($0.7M), and Home Office ($0.4M) segments.
Geographic & State Analysis: Bar chart showcasing top-performing states (California, New York, Texas, Washington) and regional revenue distribution (West, East, Central, South).
Profit Margin Analysis: Dedicated percentage bar chart highlighting profit margins by category, pinpointing high-margin categories like Technology vs. lower-margin categories like Furniture.
Technical Stack & Features:
Microsoft Excel: Built using PivotTables, PivotCharts, Advanced Formulas, and Interactive Slicers.
Data Cleaning & Modeling: Structured raw transactional data to handle profit margins and performance trends.
UI/UX Design: Formatted with a clean burgundy-and-navy corporate theme for effortless decision-making.