Employee Performance & Payroll Dashboard
تفاصيل العمل
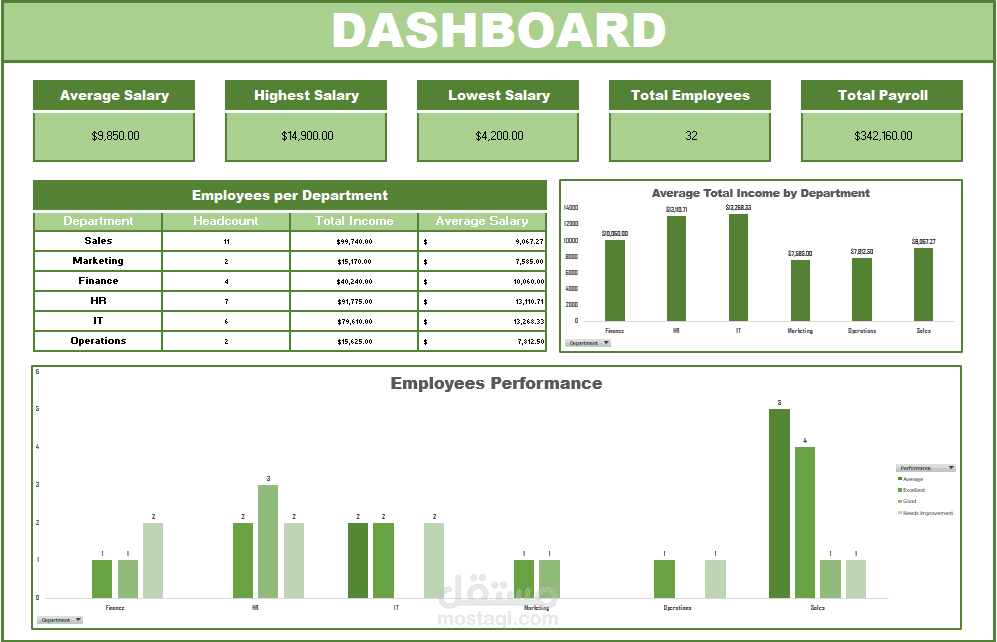
I built an Excel-based Employee Performance & Payroll Dashboard to organize employee data, calculate payroll metrics, and provide a clear management-level view of salaries, bonuses, and department performance.
The project transforms structured employee data into an easy-to-use reporting dashboard with KPIs, department analysis, Pivot Tables, and visual charts.
What I Built
Structured employee data using Excel Tables
Salary, bonus, and total income calculations
Employee and department-level analysis
KPI cards for key payroll metrics
Pivot Tables and Pivot Charts
Department headcount and income analysis
Average, minimum, and maximum salary analysis
Clean and professional dashboard layout
Key Metrics
Total Employees
Average Salary
Highest Salary
Lowest Salary
Total Payroll
Total Bonus
Department Headcount
Average Income by Department
Tools & Skills
Microsoft Excel · Excel Tables · Structured References · IF · COUNTIF · SUMIF · AVERAGEIF · Pivot Tables · Pivot Charts · Dashboard Design · Data Analysis · KPI Reporting
Business Value
The dashboard converts raw employee information into a practical management report that makes payroll and department-level analysis easier to understand and review.
Deliverable
An editable Excel workbook containing the source data, calculations, analysis, Pivot Tables, charts, and final dashboard.