Inventory Management & Stock Dashboard
تفاصيل العمل
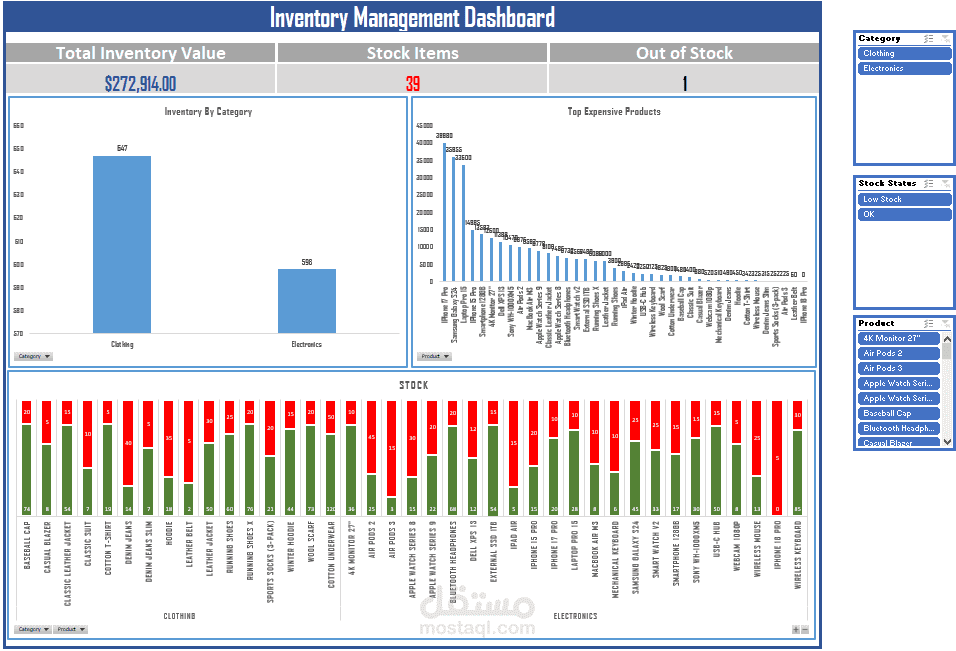
I built an Excel Inventory Management Dashboard to monitor product stock levels, inventory value, minimum stock requirements, and products that need to be reordered.
The project transforms inventory data into a practical reporting dashboard that helps identify stock shortages and monitor inventory performance.
What I Built
Structured inventory database using an Excel Table
Inventory value calculations
Stock status calculations
Reorder and out-of-stock identification
KPI cards for inventory monitoring
Pivot Tables for category and product analysis
Pivot Charts for inventory visualization
Stock vs. Minimum Stock analysis
Clean dashboard layout
Key Metrics
Total Inventory Value
Total Products
Total Stock
Total Minimum Stock
Reorder Items
Out-of-Stock Items
Stock by Category
Inventory Value by Product
Stock vs. Minimum Stock
Tools & Skills
Microsoft Excel · Excel Tables · Structured References · IF · COUNTIF · SUMIF · Pivot Tables · Pivot Charts · Dashboard Design · Inventory Analysis · Data Visualization · KPI Reporting
Business Value
The dashboard makes it easier to identify products below their minimum stock level, monitor inventory value, and understand stock distribution across categories.
Deliverable
An editable Excel workbook containing the inventory data, calculations, analysis, Pivot Tables, charts, and final dashboard.