Employee Performance & Payroll Dashboard
تفاصيل العمل
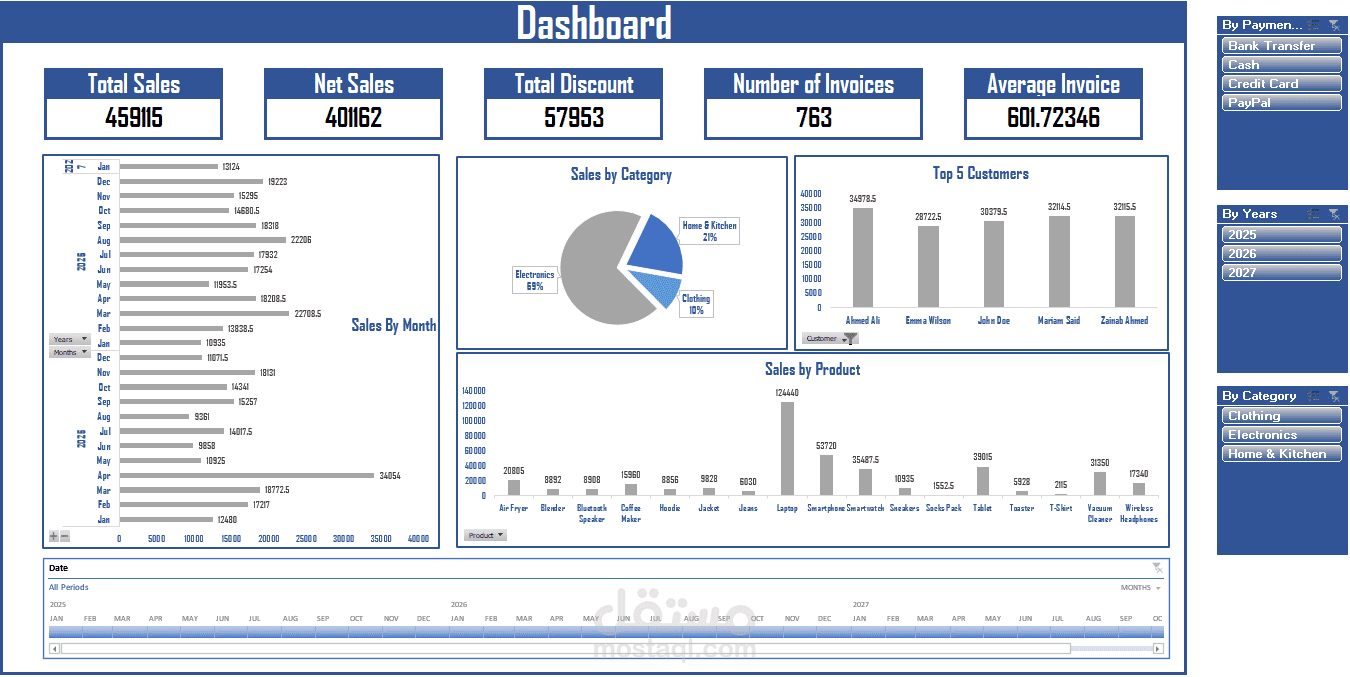
I built an interactive Excel Sales Dashboard to analyze sales performance across customers, products, categories, payment methods, and time periods.
The project combines structured sales data, formulas, Pivot Tables, Pivot Charts, KPI cards, and Slicers to create an interactive reporting solution.
What I Built
Structured sales database using an Excel Table
Sales, discount, and net sales calculations
KPI cards for key sales indicators
Pivot Tables for sales analysis
Pivot Charts for visual reporting
Interactive Slicers for filtering the dashboard
Monthly sales trend analysis
Product and category performance analysis
Top customer analysis
Clean and user-friendly dashboard
Key Metrics
Total Sales
Net Sales
Total Discounts
Number of Invoices
Average Invoice Value
Monthly Sales
Sales by Category
Sales by Product
Top Customers
Tools & Skills
Microsoft Excel · Excel Tables · Structured References · SUMIFS · COUNTIFS · IF · Pivot Tables · Pivot Charts · Slicers · KPI Reporting · Data Analysis · Data Visualization · Dashboard Design
Business Value
The dashboard provides a clear and interactive way to monitor sales performance and quickly analyze different parts of the business using filters and visual reports.
Deliverable
An editable Excel workbook containing the source data, calculations, Pivot Tables, Pivot Charts, Slicers, and interactive dashboard.