Sales & Profit Performance Analysis Dashboard | Excel & Power BI
تفاصيل العمل
Project Overview:
A comprehensive Sales and Profitability Analysis project designed to evaluate business revenue trends, regional performance, product categories, and sales team productivity using Excel and Power BI.
Key Implementation Steps & Technical Features:
1. Data Processing & Excel Cleaning:
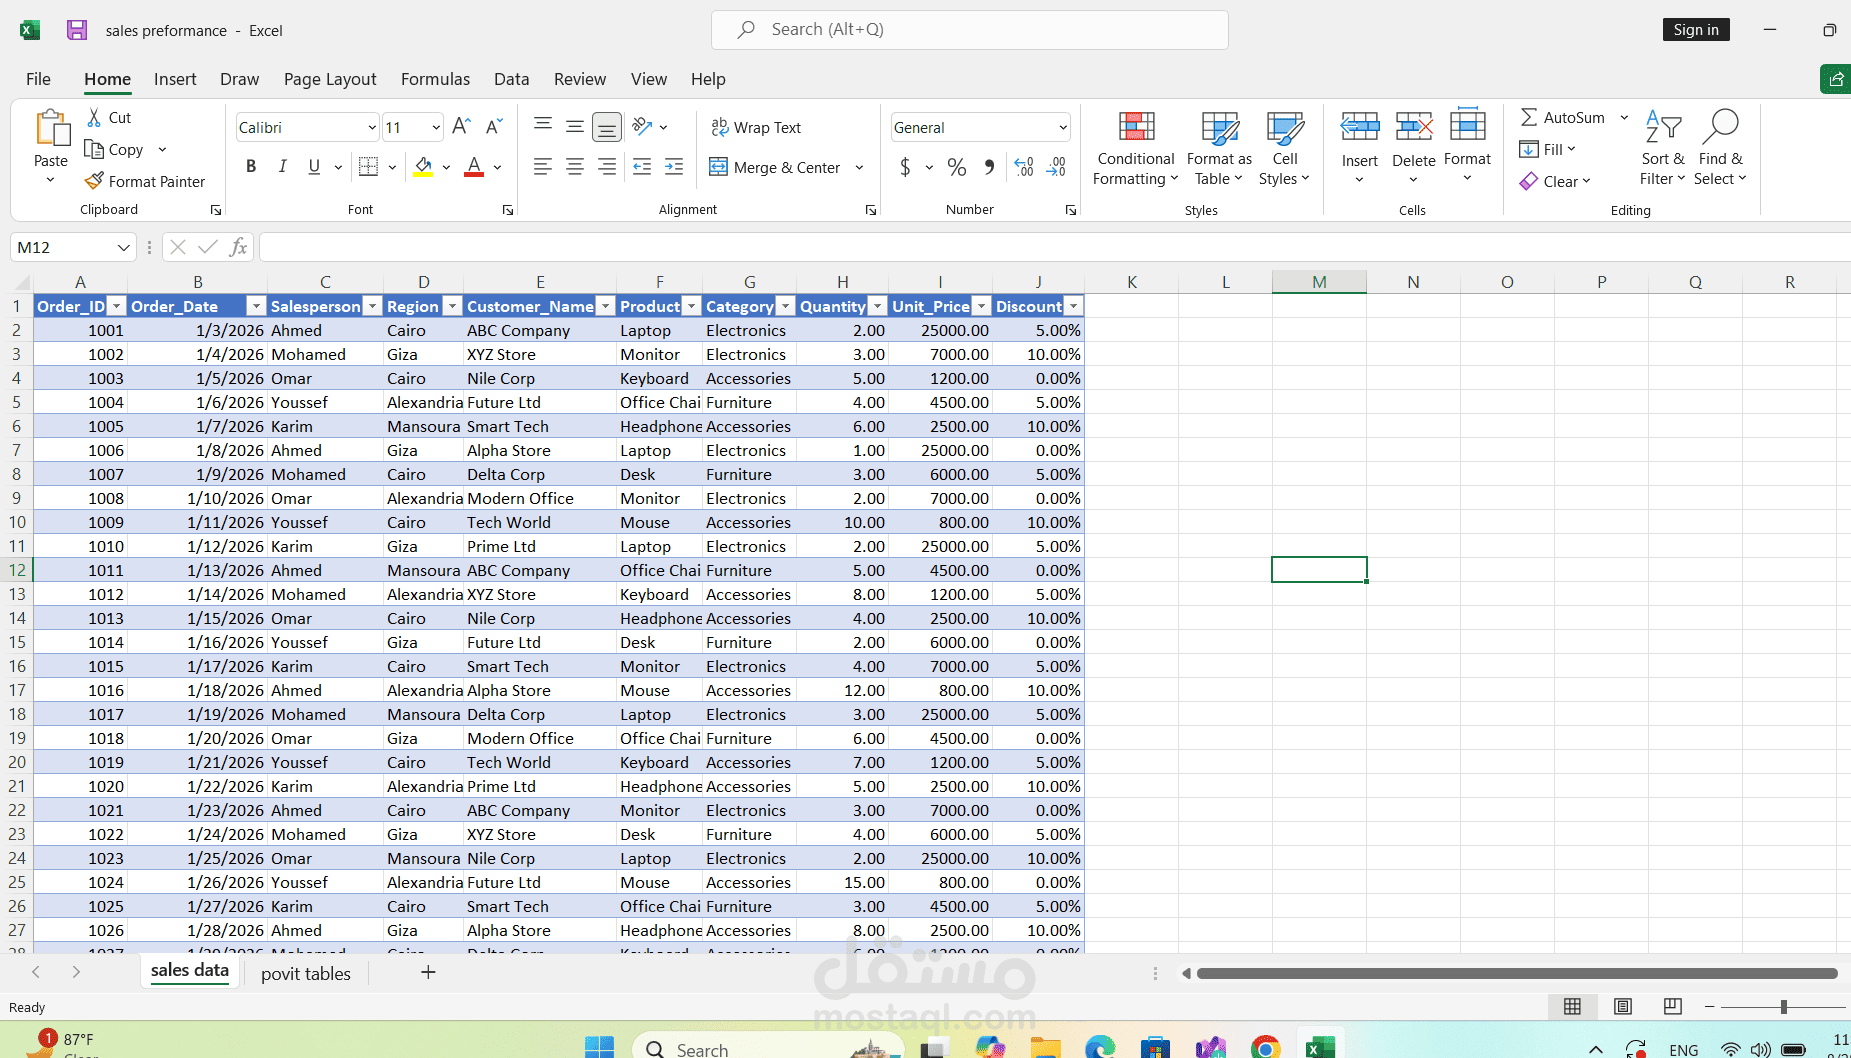
- Cleaned and organized raw sales transaction records in Microsoft Excel.
- Structured dataset columns including Order ID, Order Date, Salesperson, Region, Customer Name, Product, Category, Quantity, Unit Price, Discount, and Net Sales.
- Created summary Pivot Tables and dynamic reporting sheets (Sales by Region, Revenue by Salesperson, Revenue by Category, Quantity by Product).
2. Power BI Analytics & Data Modeling:
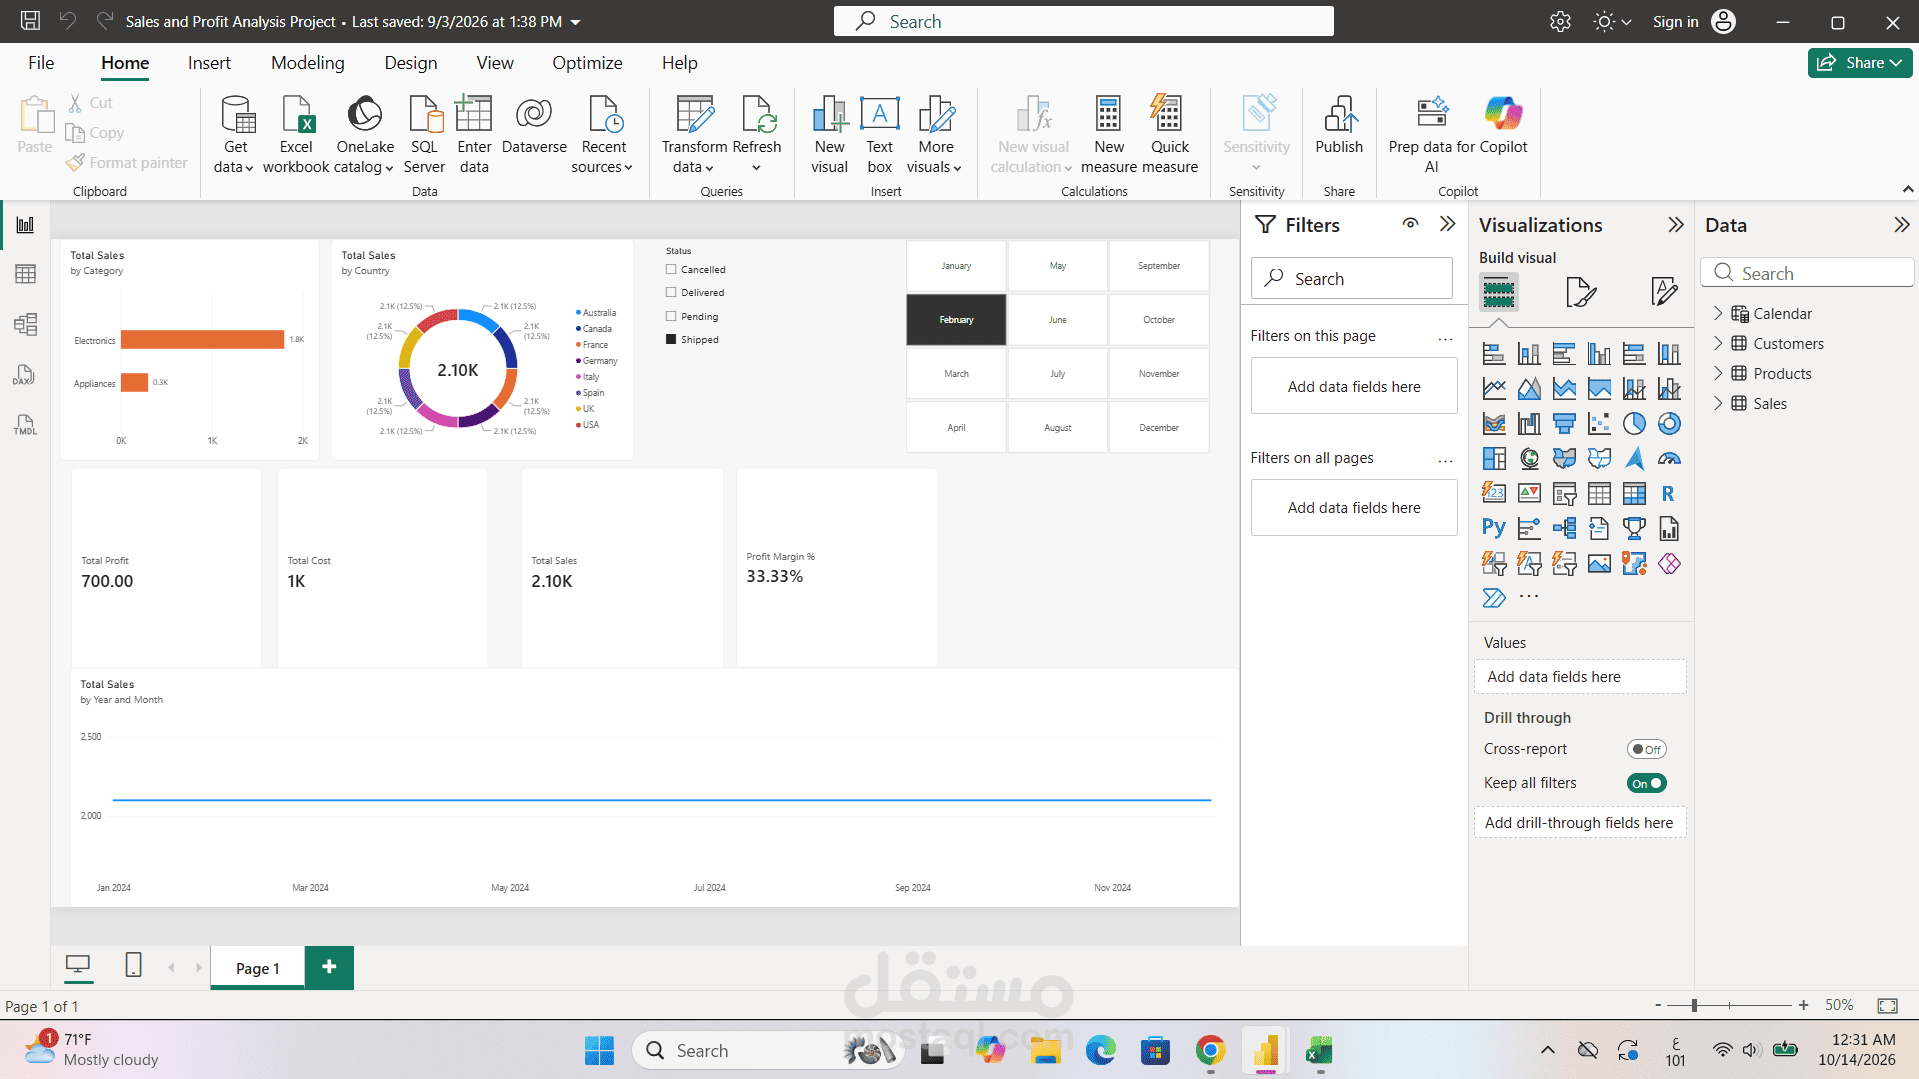
- Modeled data architecture using relational tables (Sales, Products, Customers, Calendar).
- Formulated DAX metrics for Total Sales (2.10K), Total Cost (1K), Total Profit (700.00), and Profit Margin % (33.33%).
3. Interactive Dashboard Visualizations:
- Sales Breakdown by Category & Country.
- Interactive Slicers for Order Status (Cancelled, Delivered, Pending, Shipped) and Month-wise filtering.
- Time-series sales trend analysis over time.