El Ezaby Pharmacies Sales & Performance Analysis | SQL, Excel & Power BI Dashboard
تفاصيل العمل
Project Overview:
A comprehensive Sales & Performance Analysis project for El Ezaby Pharmacies chain, designed to transform raw transaction data into actionable business insights and interactive dashboards to drive data-driven decision-making.
Key Implementation Steps & Technologies:
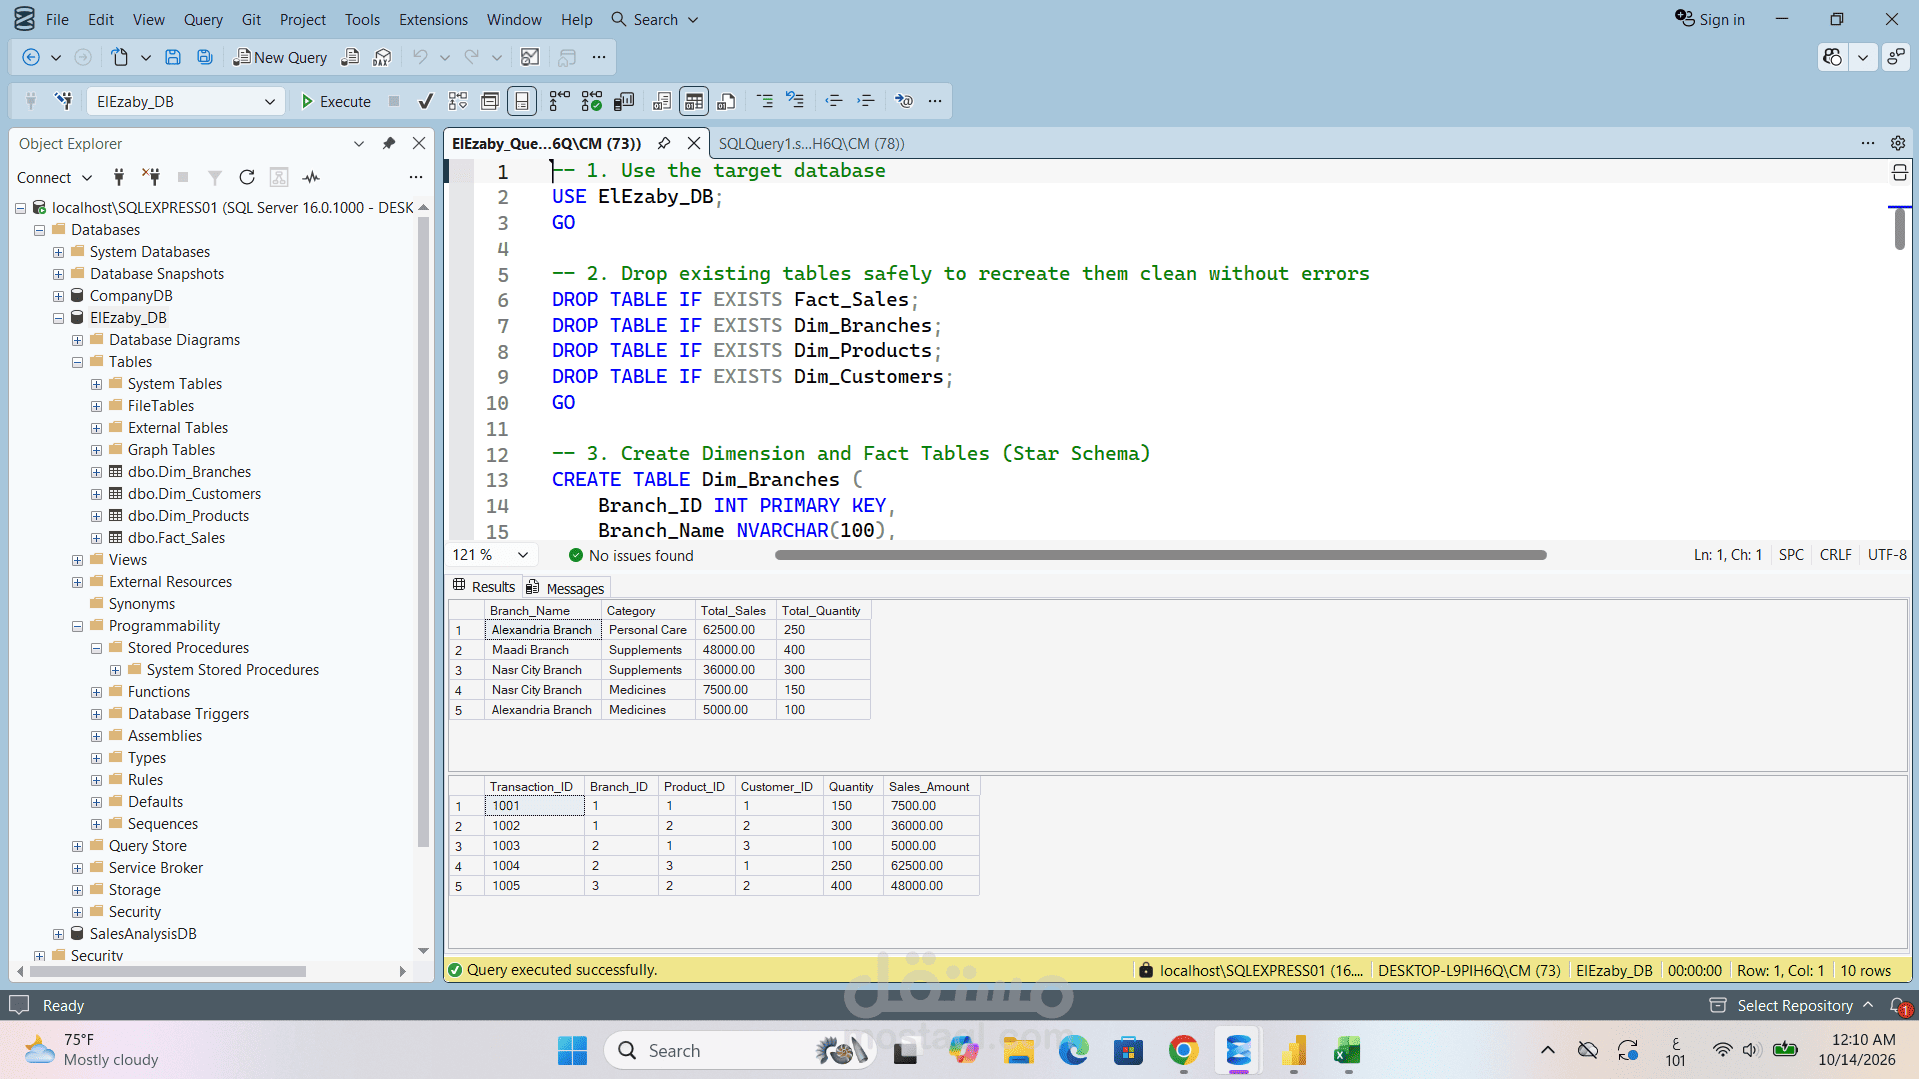
1. Database Design & Architecture (SQL Server):
- Designed and built a Star Schema data model consisting of a Fact Table (Fact_Sales) and Dimension Tables (Dim_Branches, Dim_Products, Dim_Customers).
- Developed advanced SQL queries for calculating Total Sales, Quantities Sold, and Branch/Product Performance metrics.
- Created reusable Stored Procedures to automate key queries and analytical tasks efficiently.
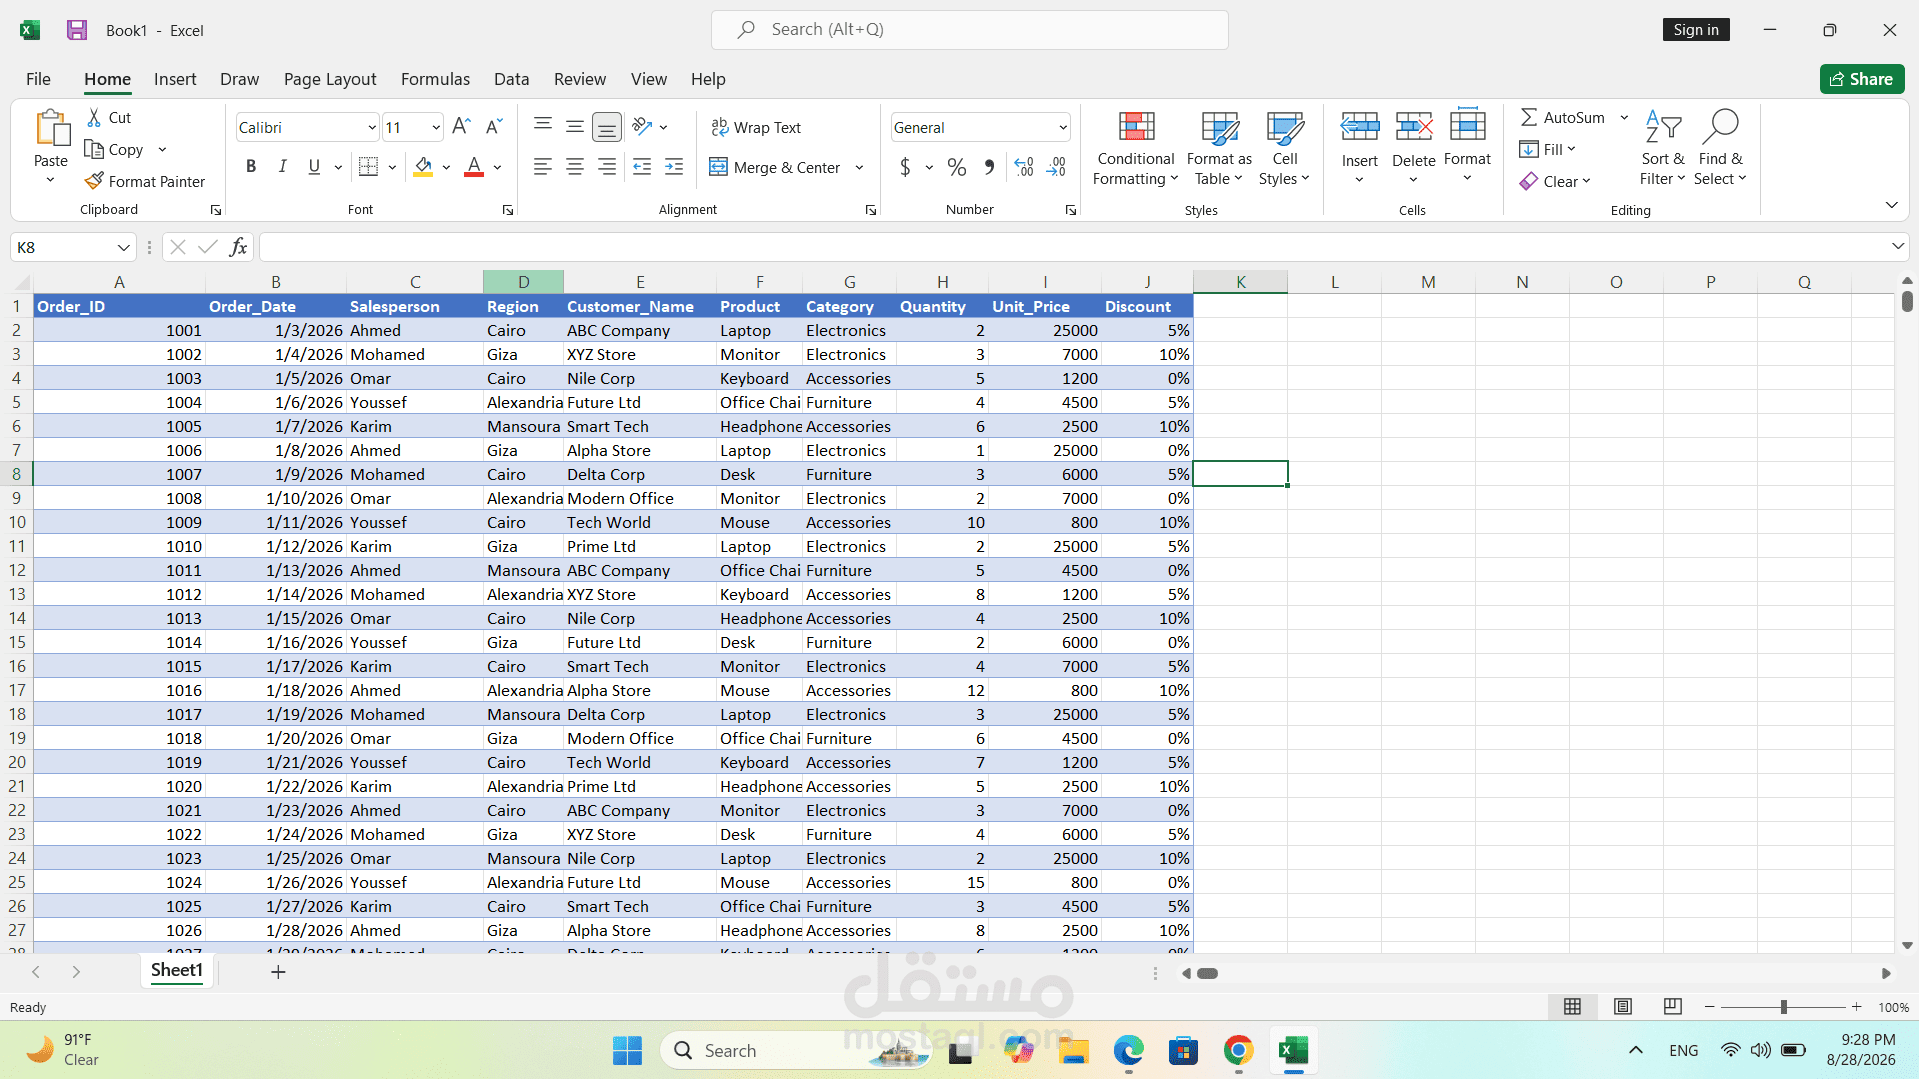
2. Data Cleaning & Transformation (Microsoft Excel):
- Performed data cleansing, validation, and structured tabular modeling.
- Applied advanced formulas to compute costs, unit prices, and overall profit margins for seamless integration.
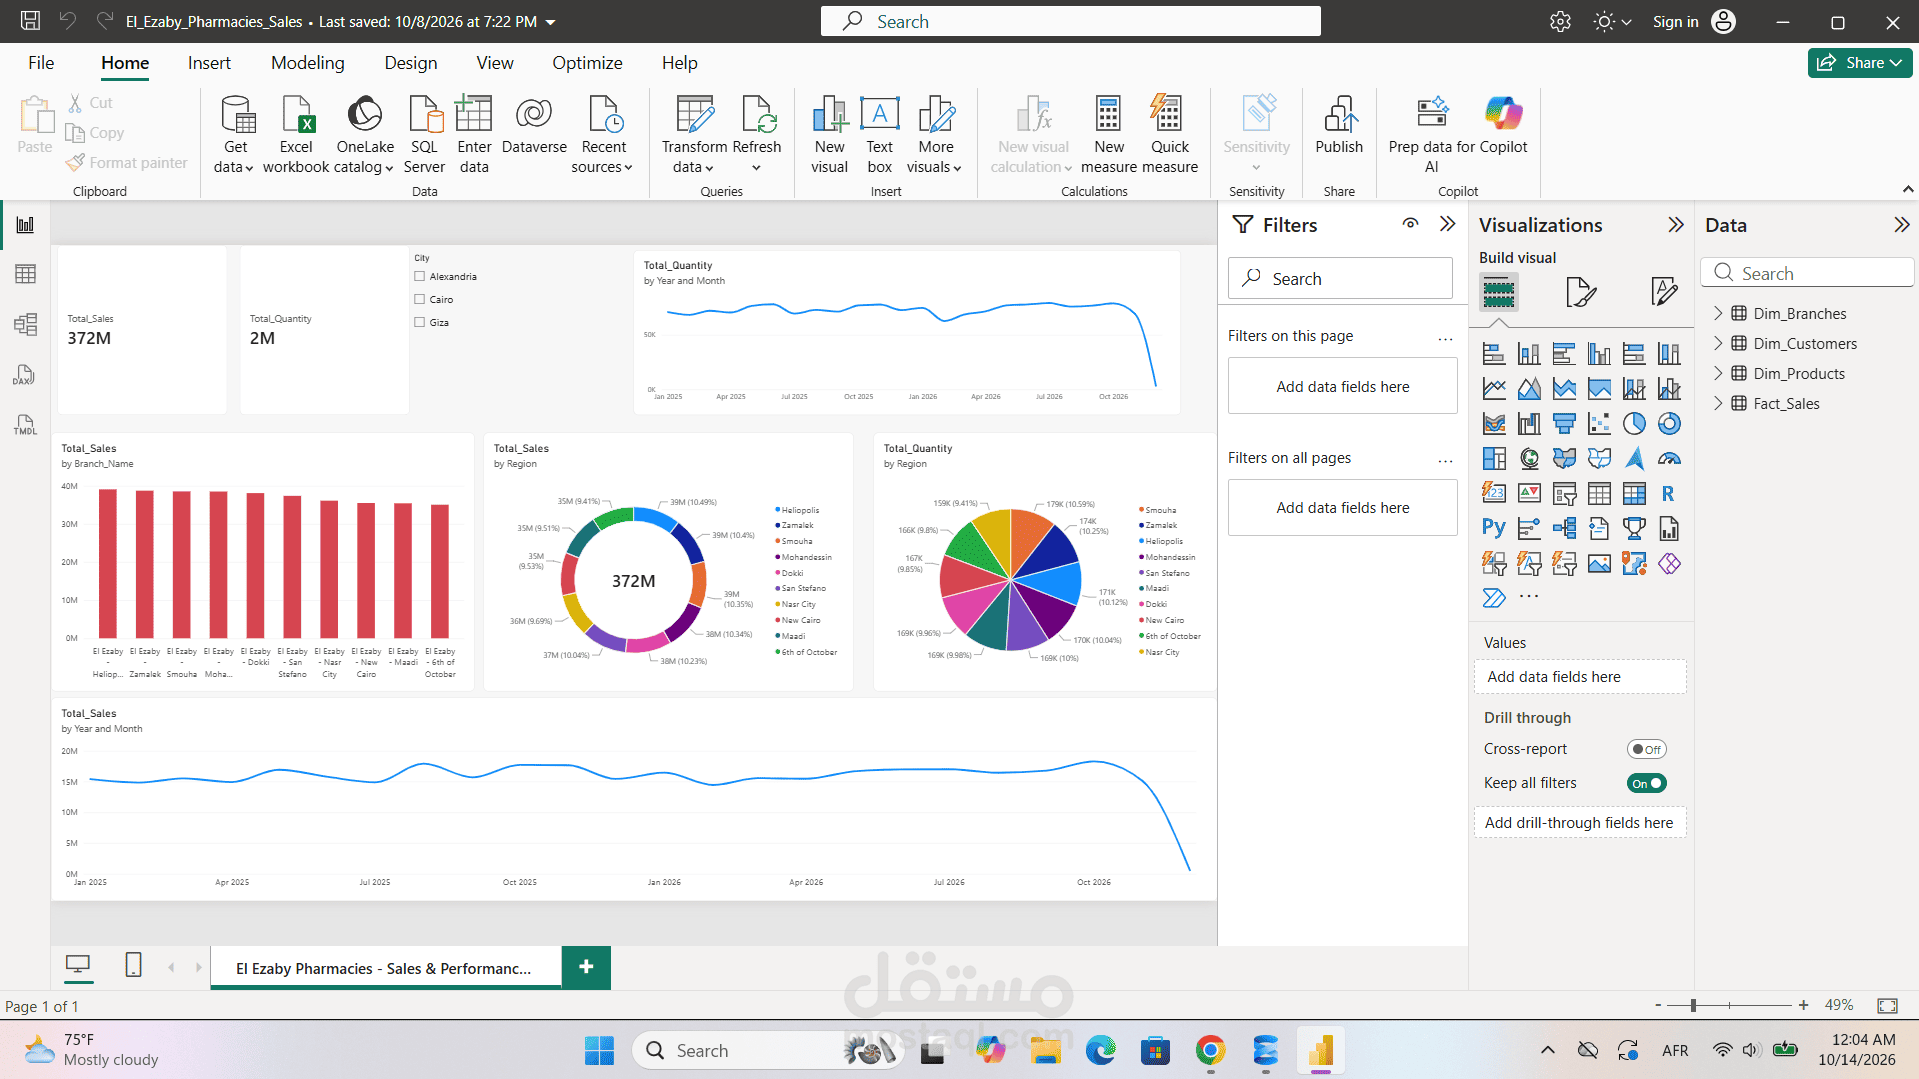
3. Interactive Dashboard & Business Intelligence (Power BI):
- Established live data connections and entity relationships across tables.
- Formulated advanced DAX measures for KPIs including Total Sales ($372M), Total Quantity Sold (2M), and Regional Performance.
- Built an interactive Power BI Dashboard featuring:
* Executive Overview & KPI Cards.
* Sales Breakdown by Branch, Region, and Product Category.
* Time-Series Sales Trend Analysis across years and months.
* Regional Distribution Charts for sales quantities and profitability.