Sales Distribution Dashboard Using Microsoft Excel
تفاصيل العمل
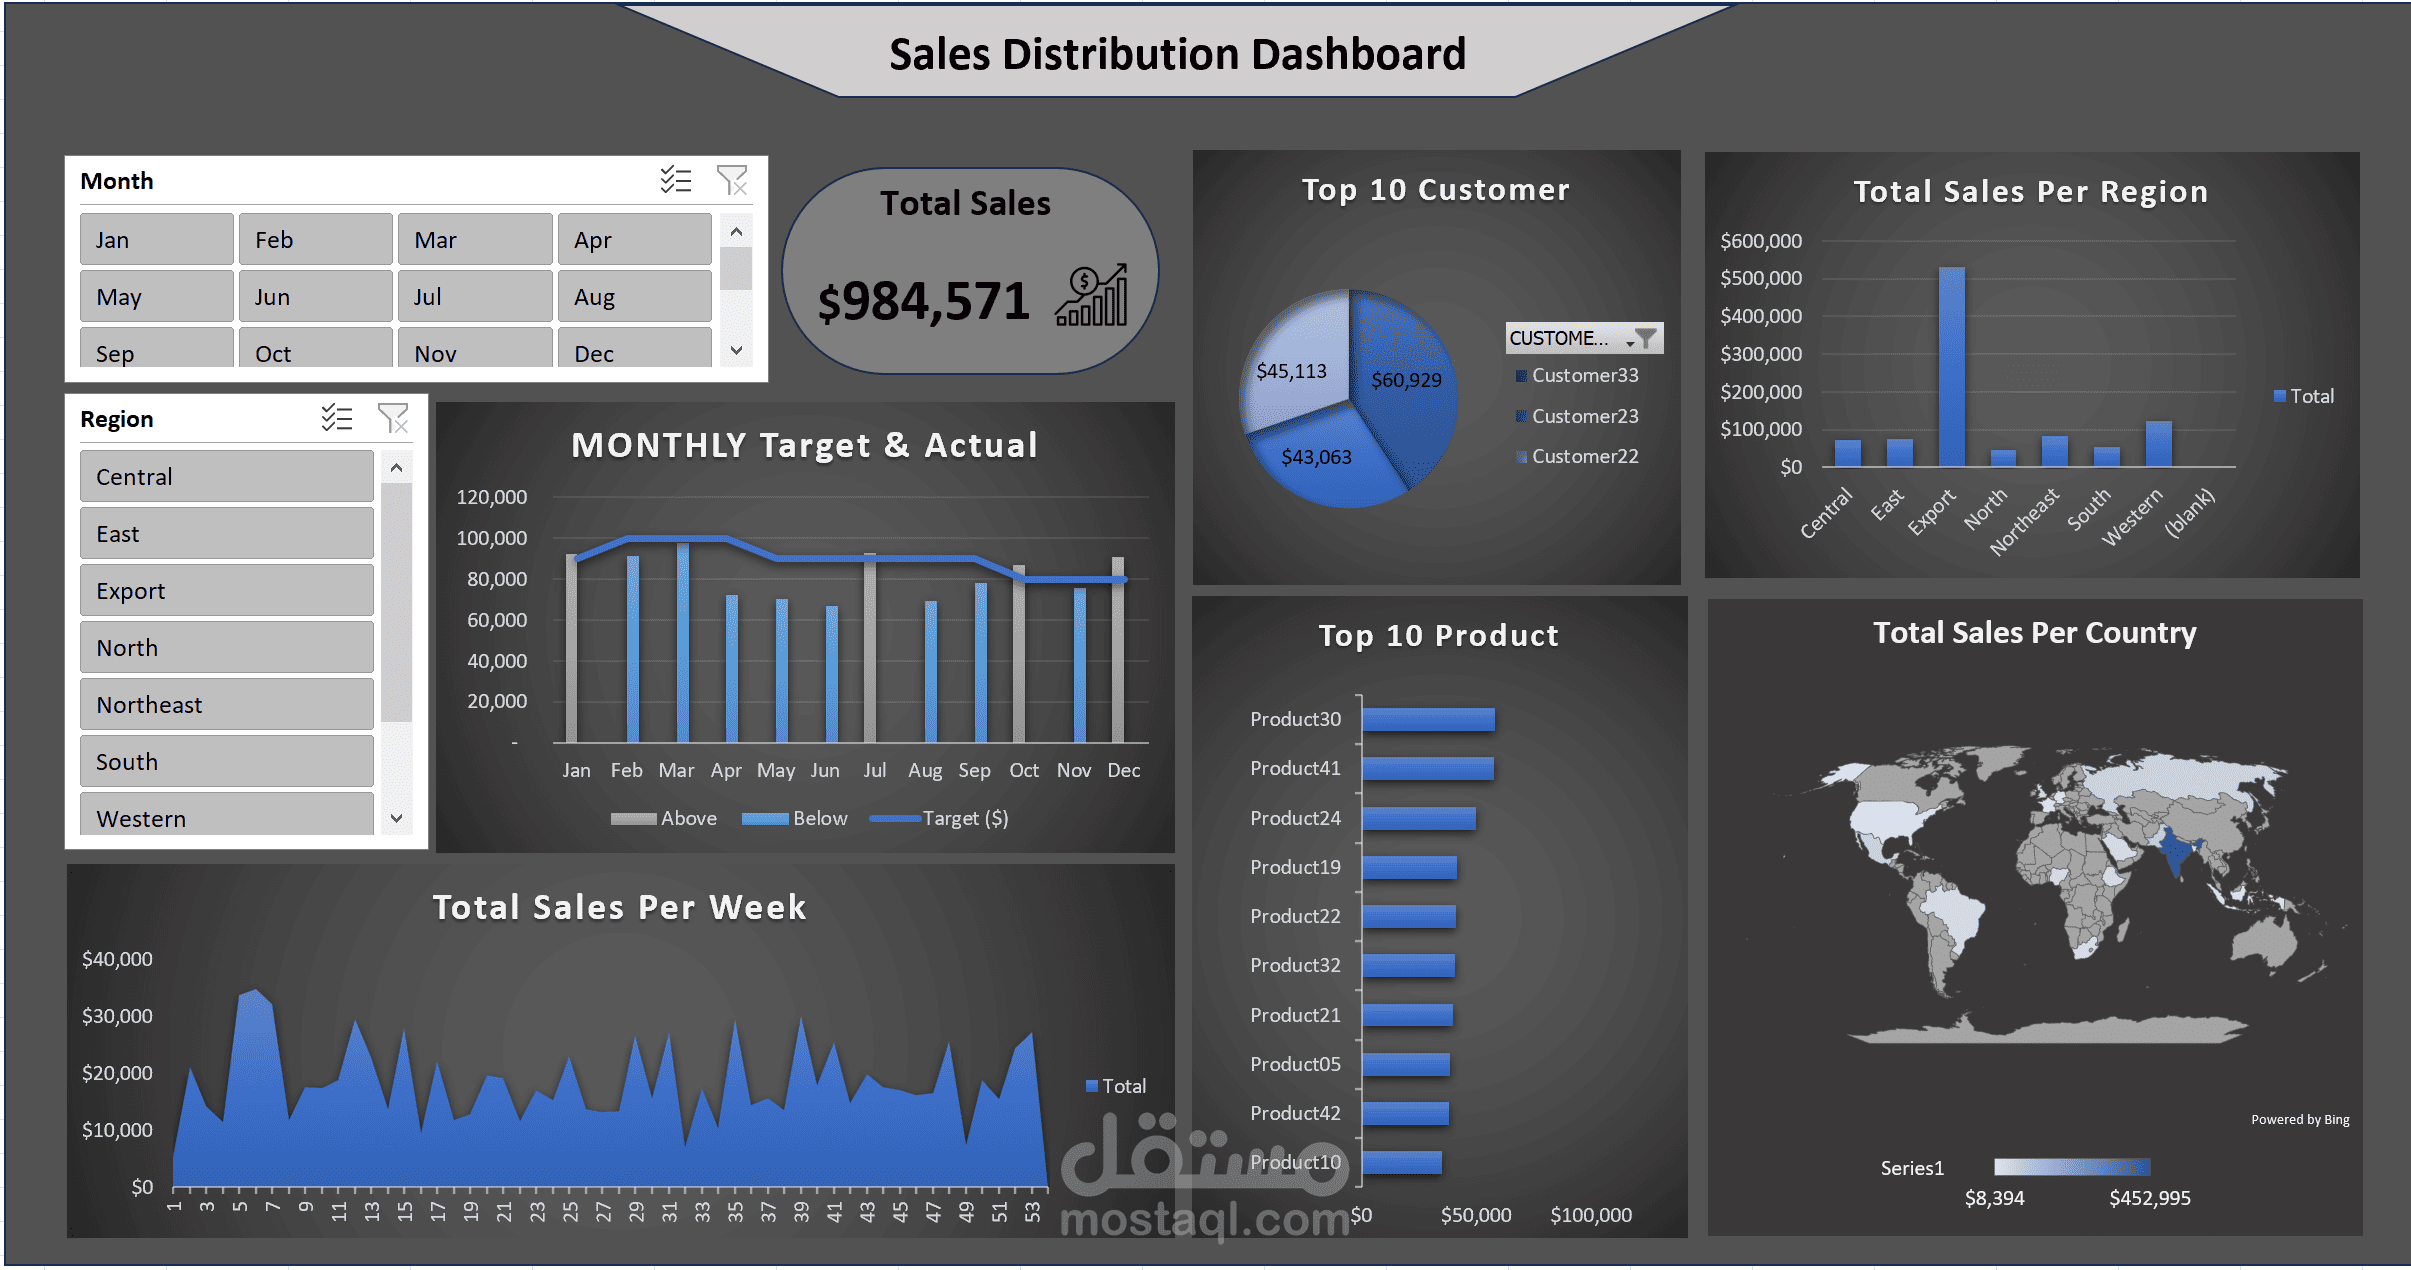
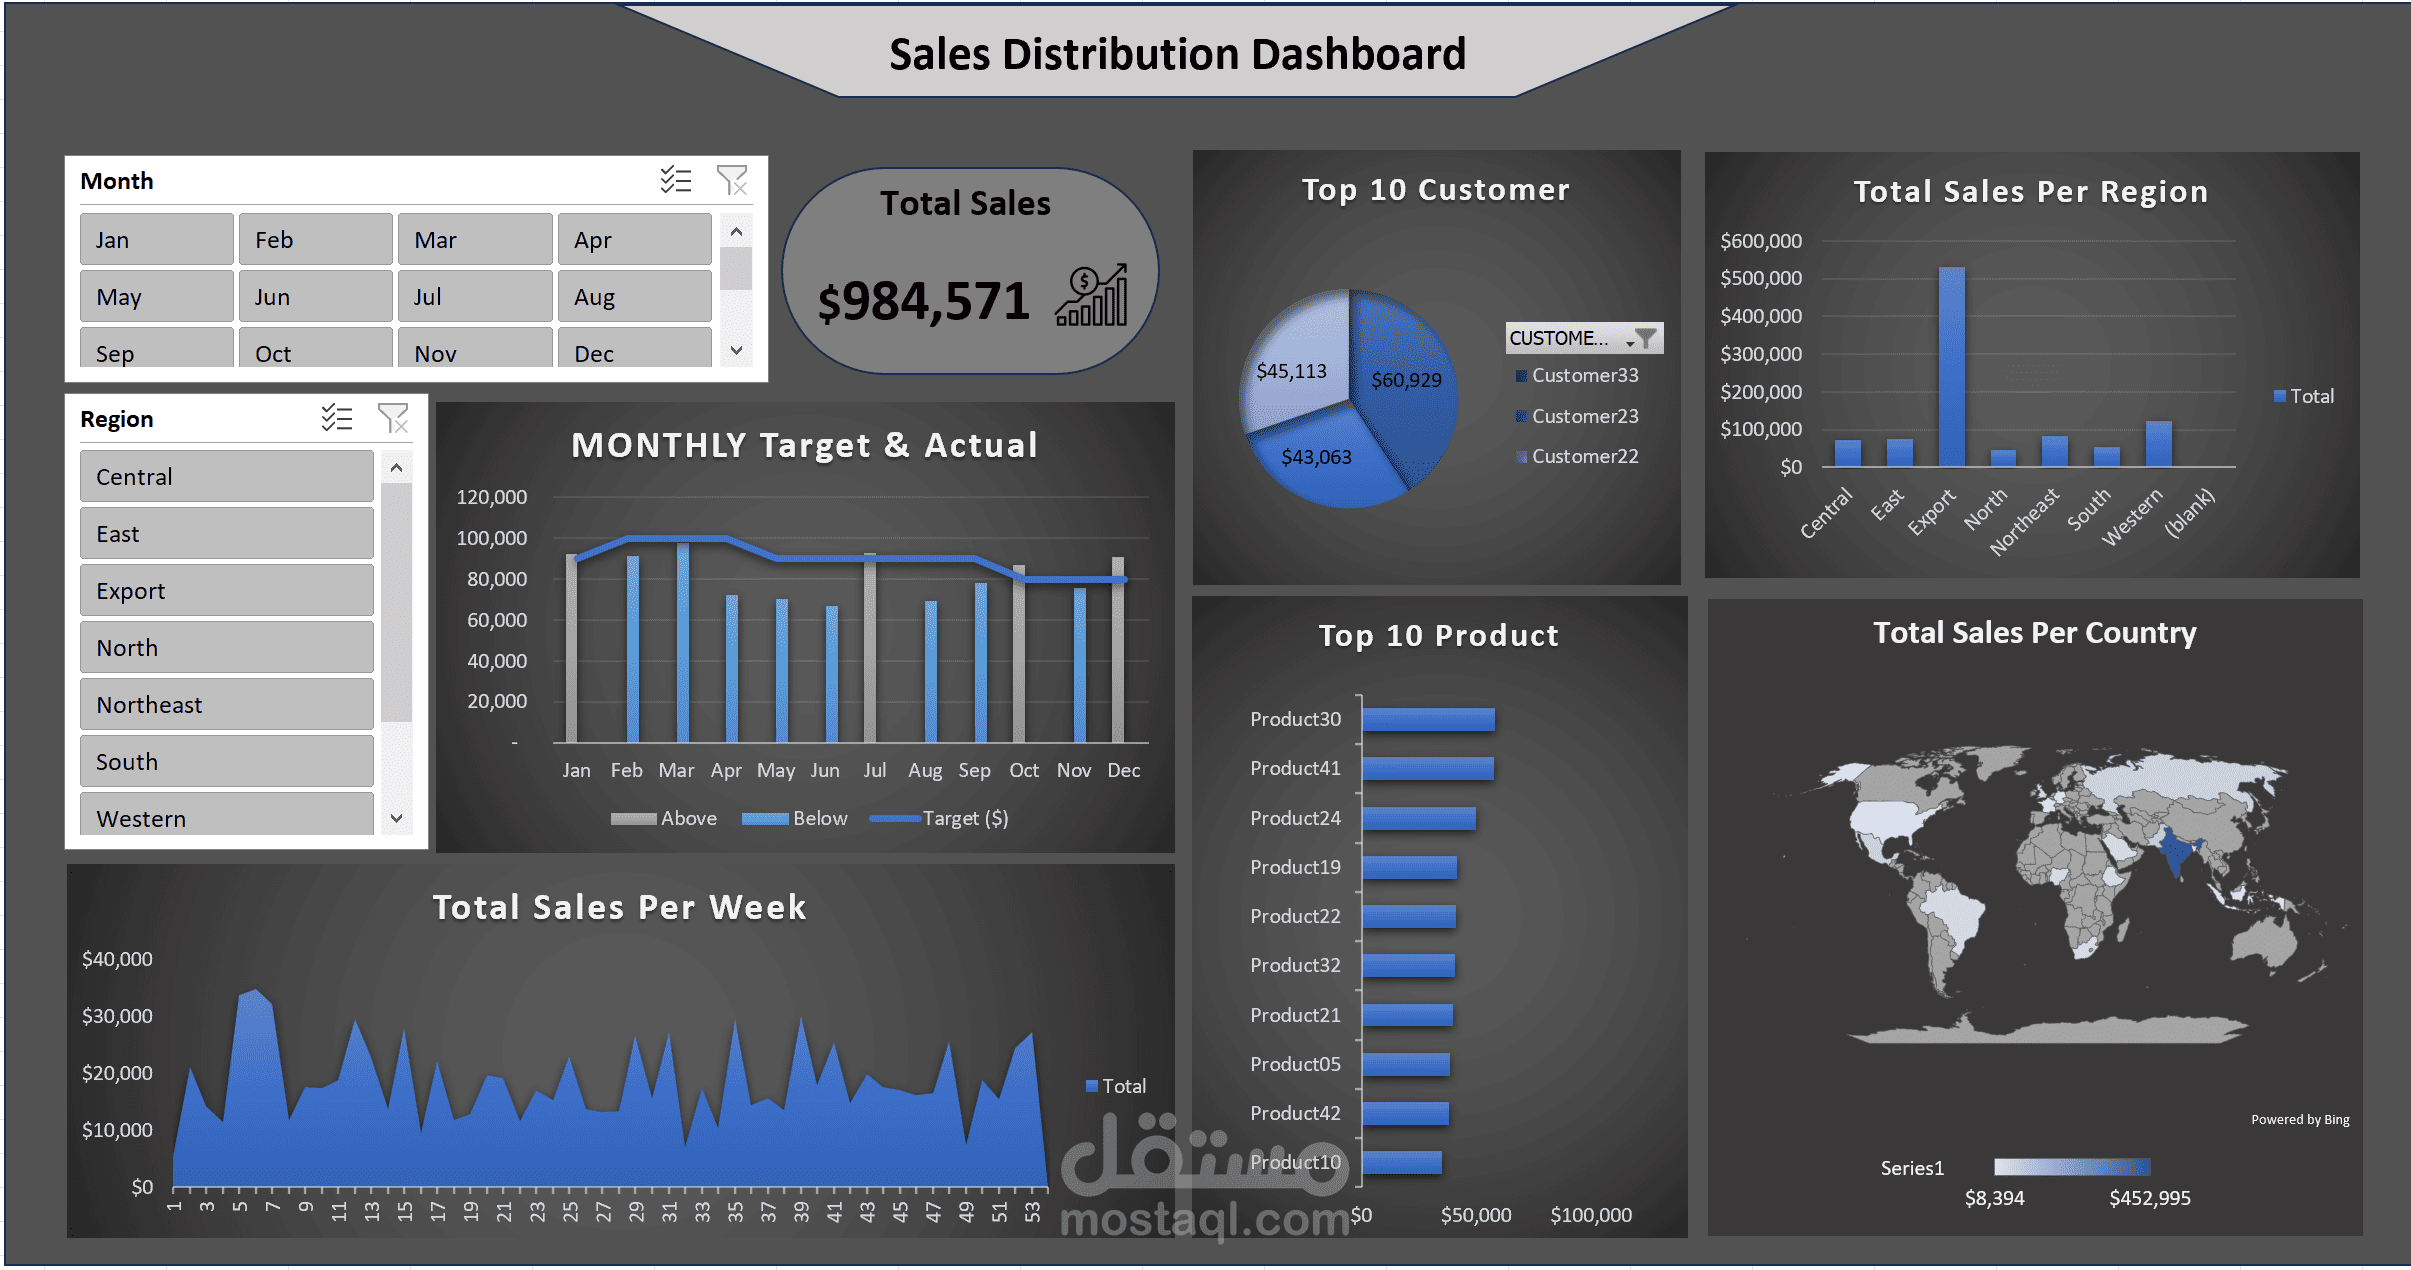
Sales Distribution Dashboard Using Microsoft Excel
Developed an interactive Sales Distribution Dashboard using Microsoft Excel to analyze sales performance across
. customers, products, countries, regions, and time periods
: Project Highlights
. Created an interactive dashboard featuring a Total Sales KPI
. Analyzed sales performance by month, week, country, and region
. Identified the top 10 customers and top 10 products by sales
. Used interactive Slicers for Month and Region to filter dashboard results dynamically
. Built analytical tables using Excel formulas to answer key business questions
. Organized data across multiple worksheets, including Input Data, Target, Customer Details, and Sales Analysis
. Compared actual sales against monthly targets to identify performance above or below expectations
: Key Business Questions Analyzed
? What are the total sales
? How do sales vary by month and week
? Who are the top 3 customers by sales
? What are the top 10 products by sales
? How are sales distributed across regions and countries
? Did actual sales meet, exceed, or fall below monthly targets
In addition to these questions, the project includes further analyses to explore sales patterns and understand
. business performance
. Tools Used: Microsoft Excel, Excel Formulas, Tables, Charts, Slicers, and Dashboard Design
Project Objective: To help users monitor sales distribution, identify top-performing customers and products, compare
. performance across regions and time periods, and track progress toward monthly sales targets