Product Performance Analysis Dashboard Using Microsoft Excel
تفاصيل العمل
Product Performance Analysis Dashboard Using Microsoft Excel
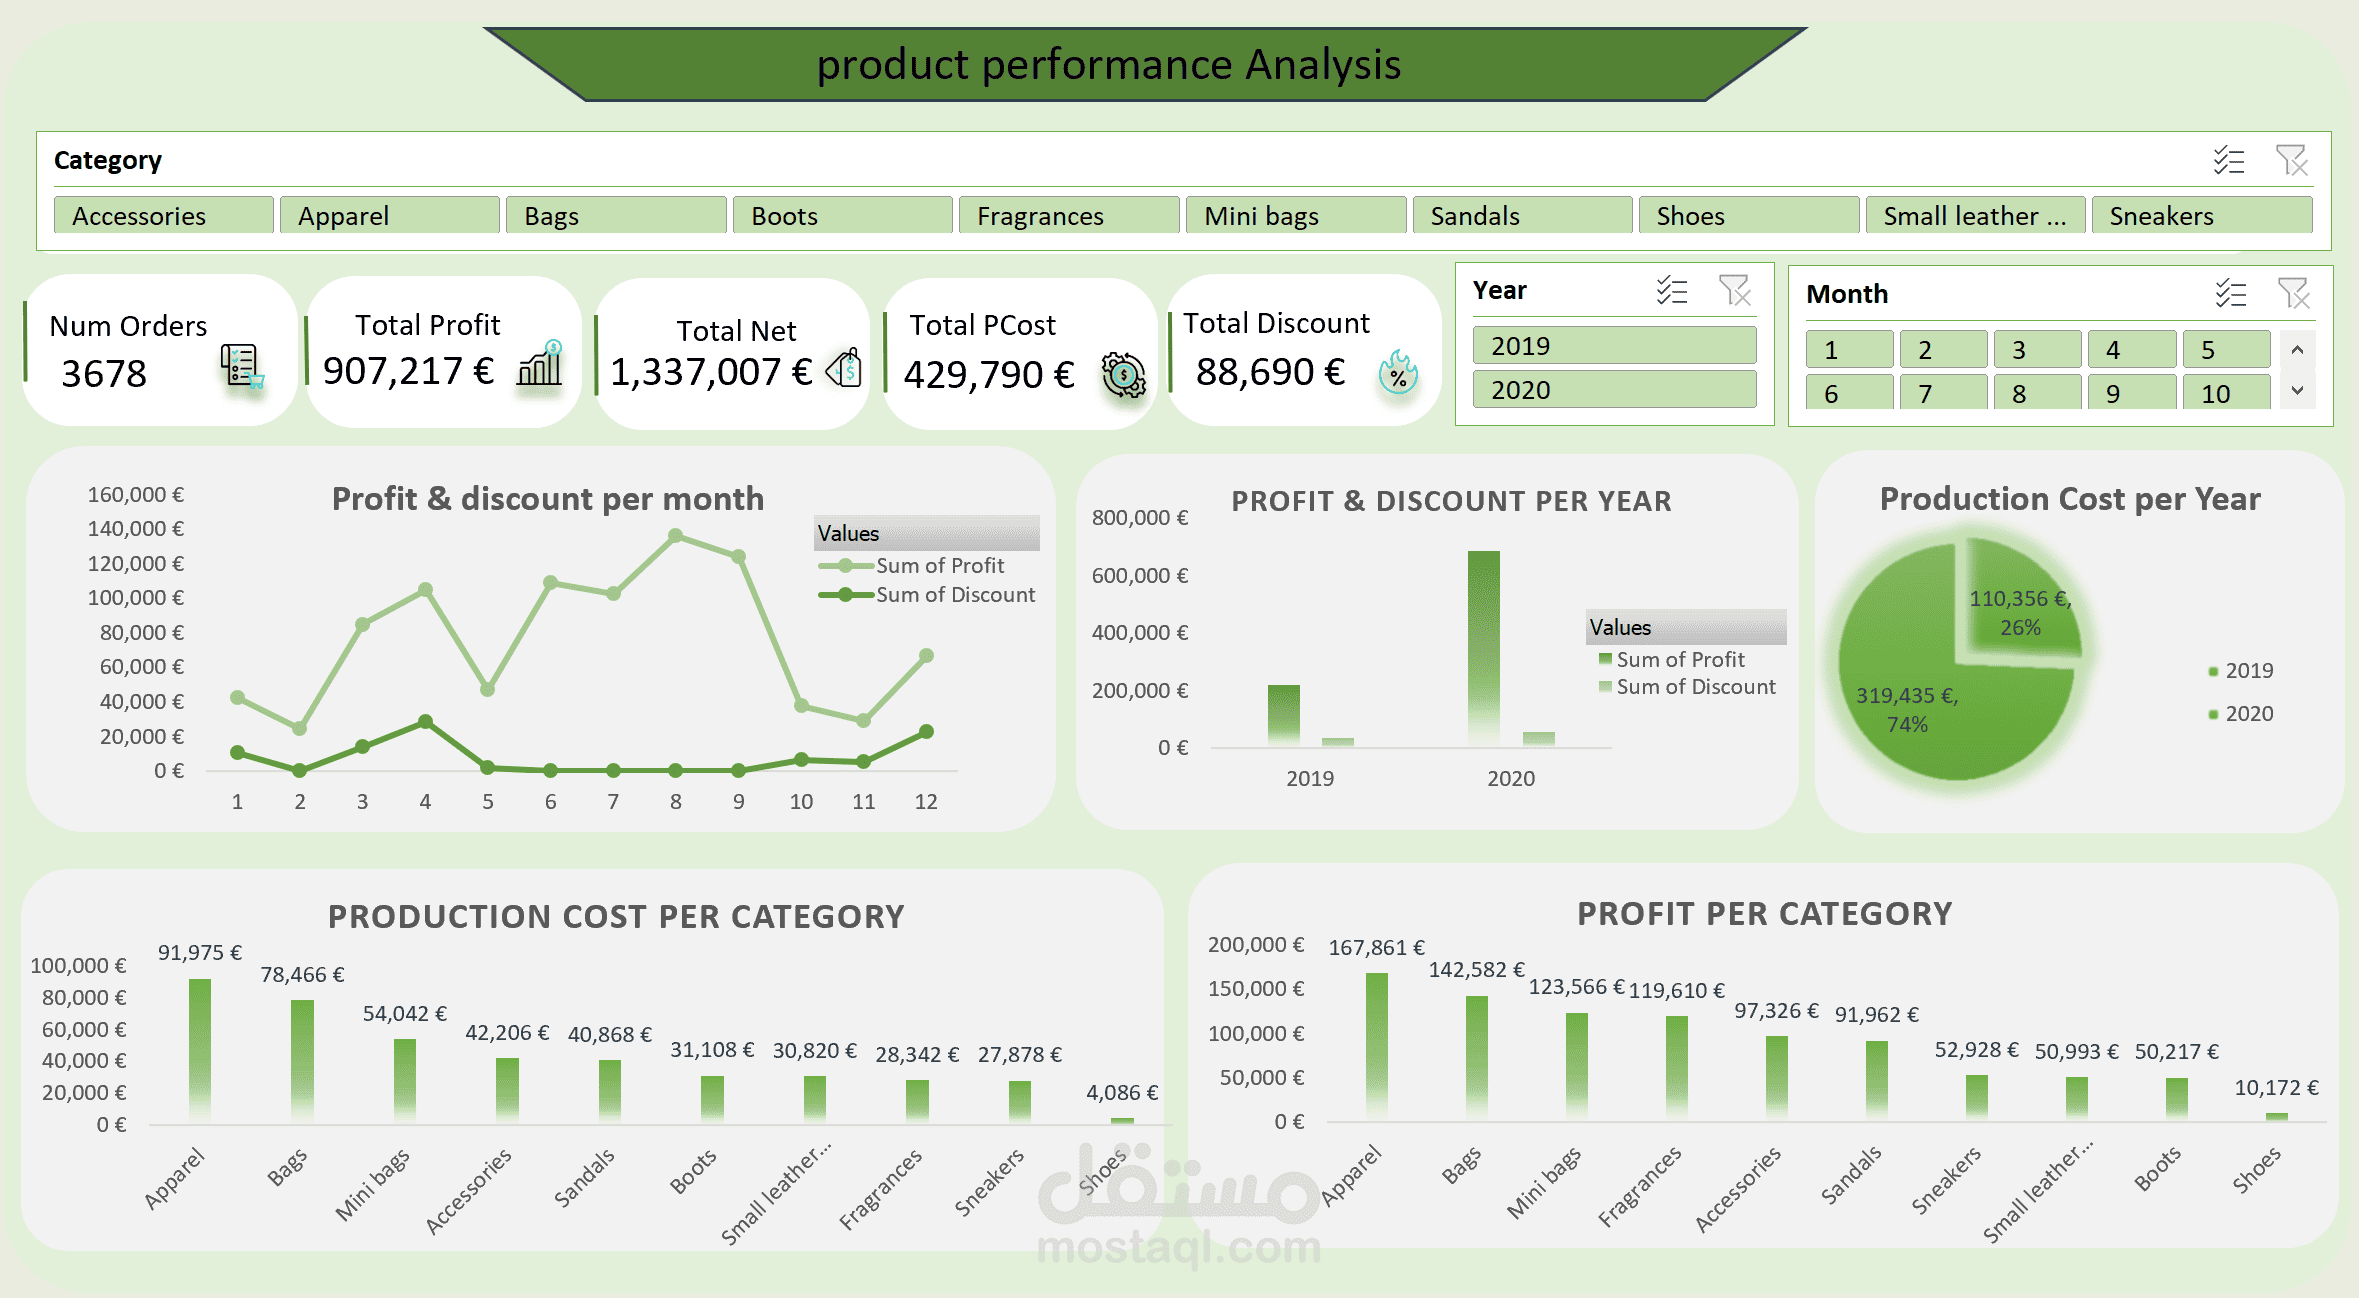
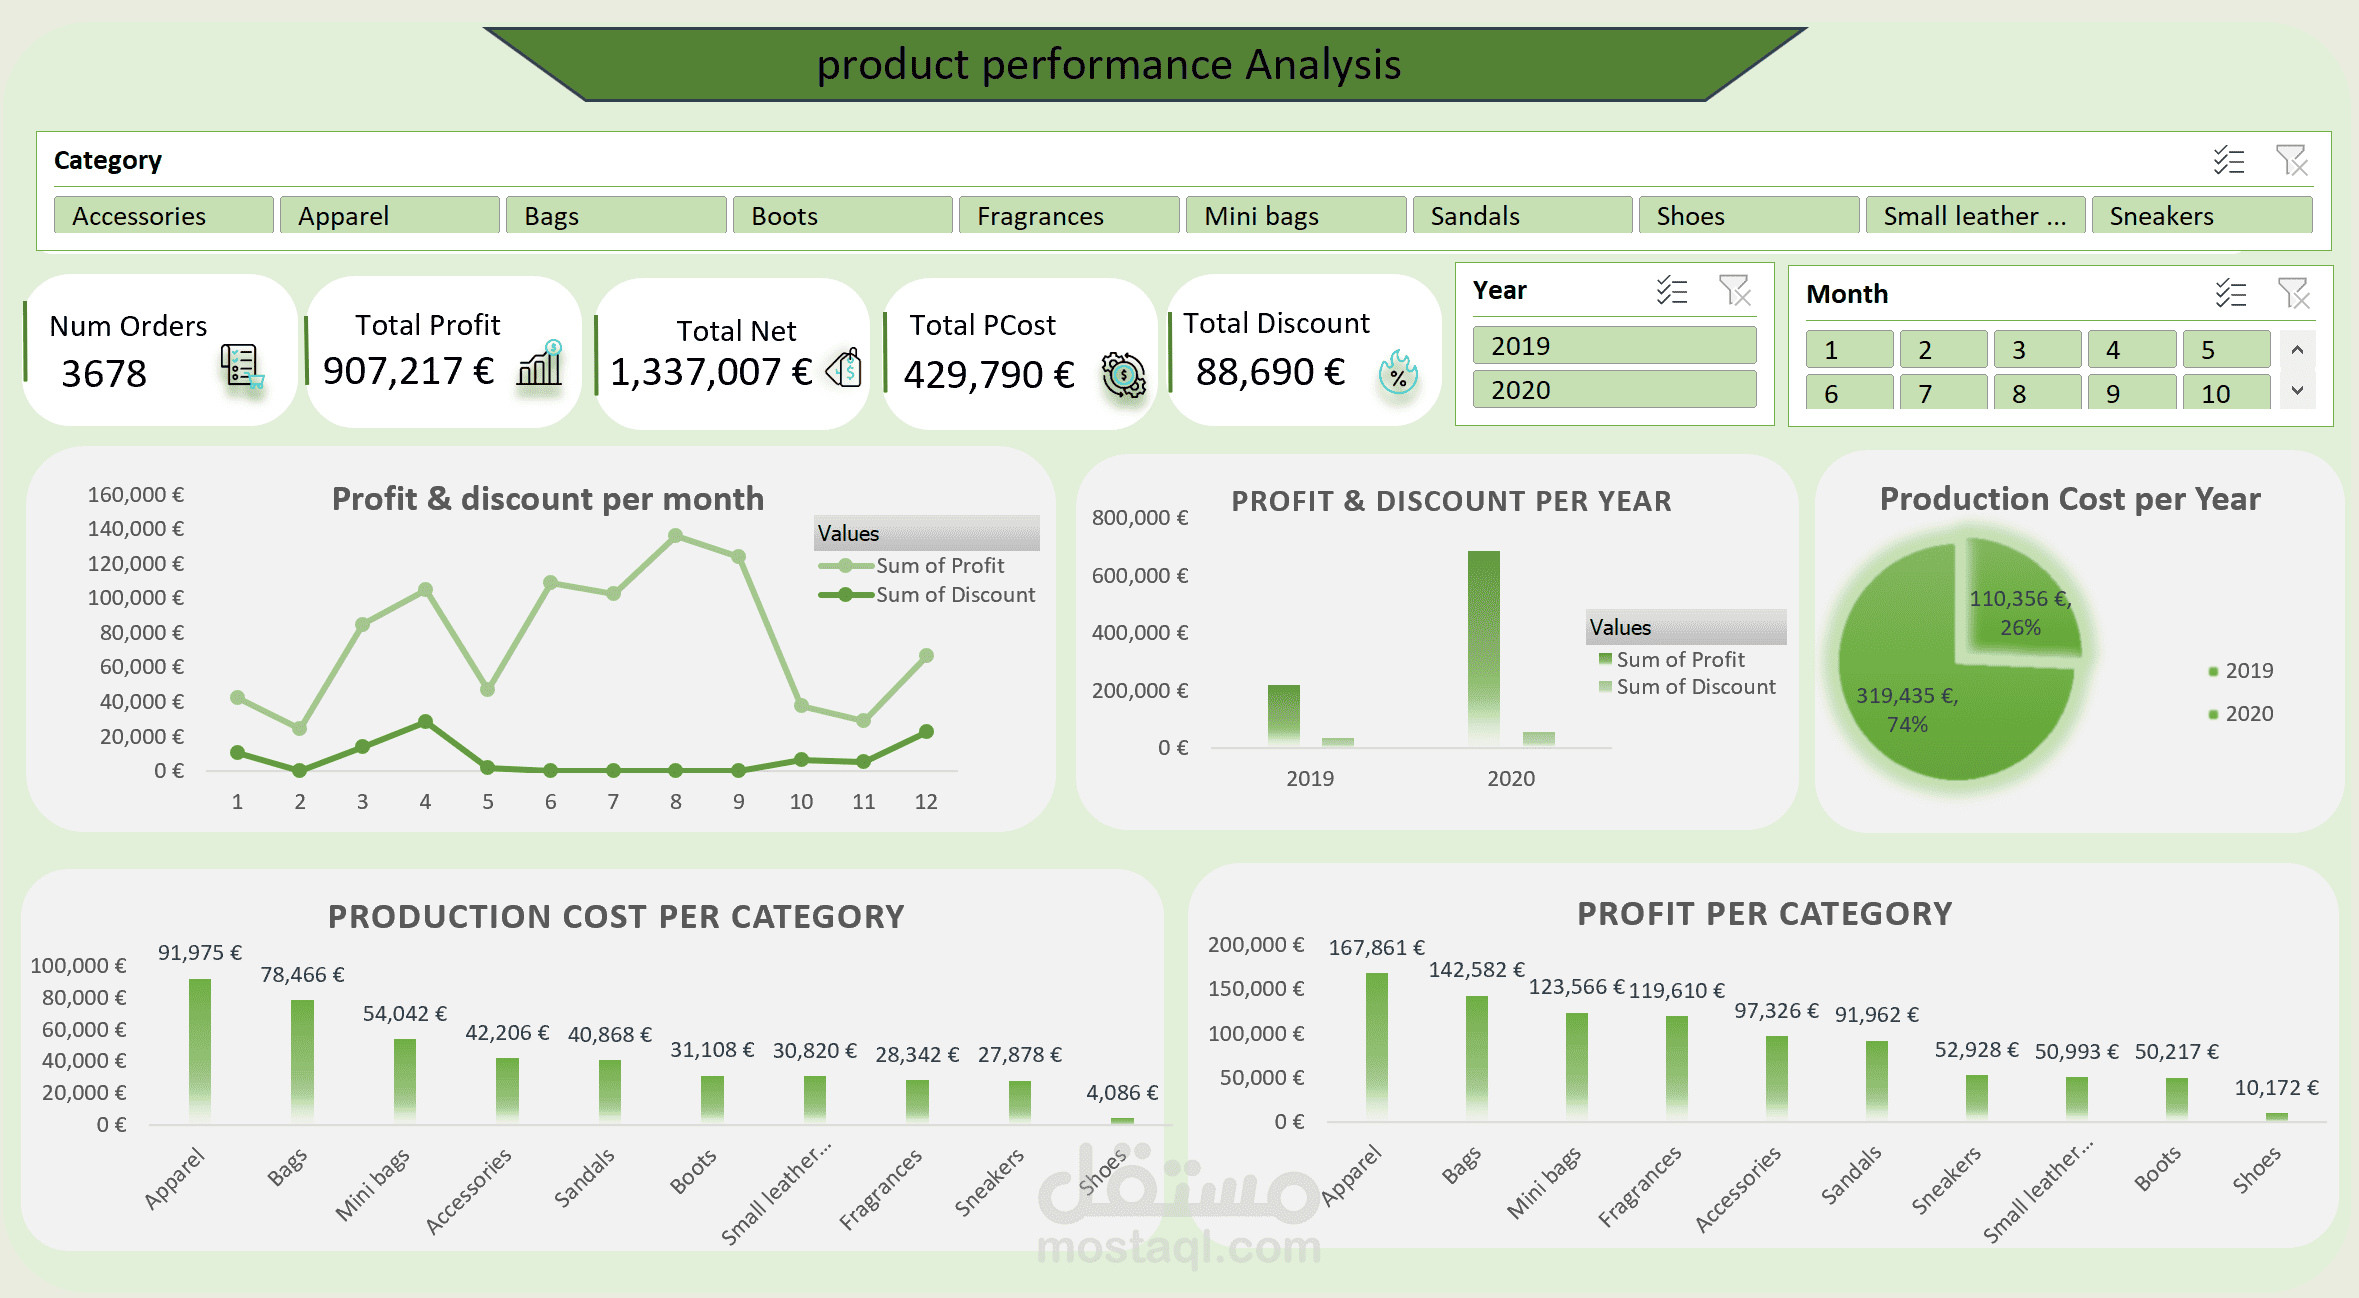
Developed an interactive Excel dashboard to analyze product performance, sales, profitability, production costs, and discounts, transforming raw data into meaningful insights to support business decision-making.
: Project Highlights
.Created an interactive dashboard featuring five Key Performance Indicators (KPIs)
.Used PivotTables to summarize and analyze business data
. Added interactive Slicers for Category, Year, and Month to enable dynamic filtering
. Created charts and analytical tables to explore trends and compare performance
. Analyzed key metrics, including total orders, total net price, total profit, total production cost, and total discount
: Key Business Questions Analyzed
? What is the most expensive product
? Which Customer ID has the highest number of orders
? Which product has the highest discount
? How do product prices compare before and after discounts
? How do profit and discount trends change by month and year
? How does profit vary by category
? How does production cost vary by year
? What is the total production per category
These are some of the key questions addressed in the project, alongside additional analyses that provide further
. insights into product performance and business trends
. Tools Used: Microsoft Excel, PivotTables, Slicers, Charts, and Interactive Dashboard Design
Project Objective: To transform business data into a clear, interactive dashboard that helps users explore
. performance, identify trends, and make more informed decisions