Professional Excel Dashboards and Interactive Reports for Data Analysis and Decision-Making
تفاصيل العمل
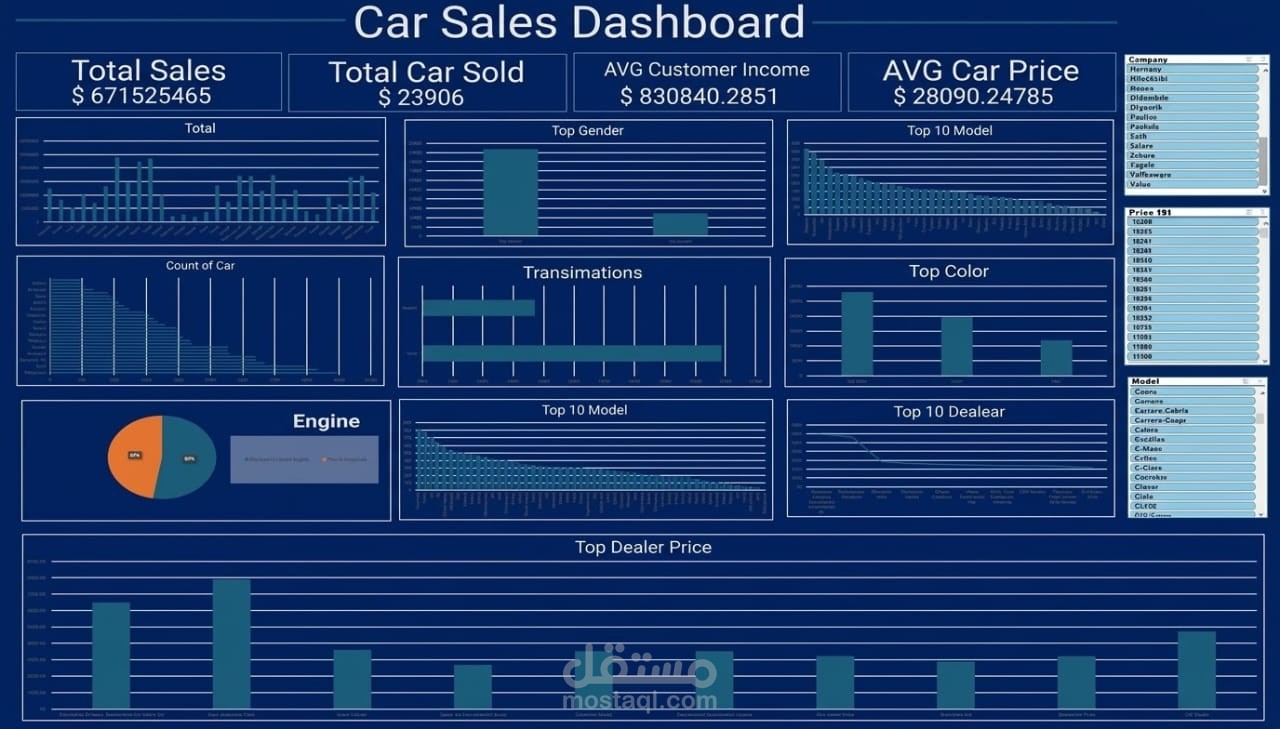
Service Description
Do you have large datasets that need to be transformed into clear, meaningful insights?
I provide professional data analysis and interactive dashboard design services using Microsoft Excel, helping you turn raw data into organized reports, visual insights, and key performance indicators that support informed decision-making.
What Does the Service Include?
Designing professional and interactive Excel dashboards
Creating clear and structured analytical reports
Using Pivot Tables and Pivot Charts to summarize and analyze data
Implementing interactive Filters and Slicers
Cleaning, organizing, and handling missing data based on project requirements
Calculating Key Performance Indicators (KPIs) and comparing results
Identifying trends, patterns, and performance changes
Applying Excel formulas and functions to automate calculations and simplify reporting
Supporting future trend forecasting using suitable analytical methods when sufficient data is available
What Will You Receive?
A well-organized Excel workbook with an interactive dashboard that helps you monitor performance, understand your data, identify improvement opportunities, and make data-driven decisions.
My goal is not just to organize numbers, but to transform your data into meaningful insights that support better planning and decision-making.
Turn your data into actionable insights with Microsoft Excel.