Interactive Sales Analytics Dashboard in Excel | Revenue, Profit & KPI Tracking
تفاصيل العمل
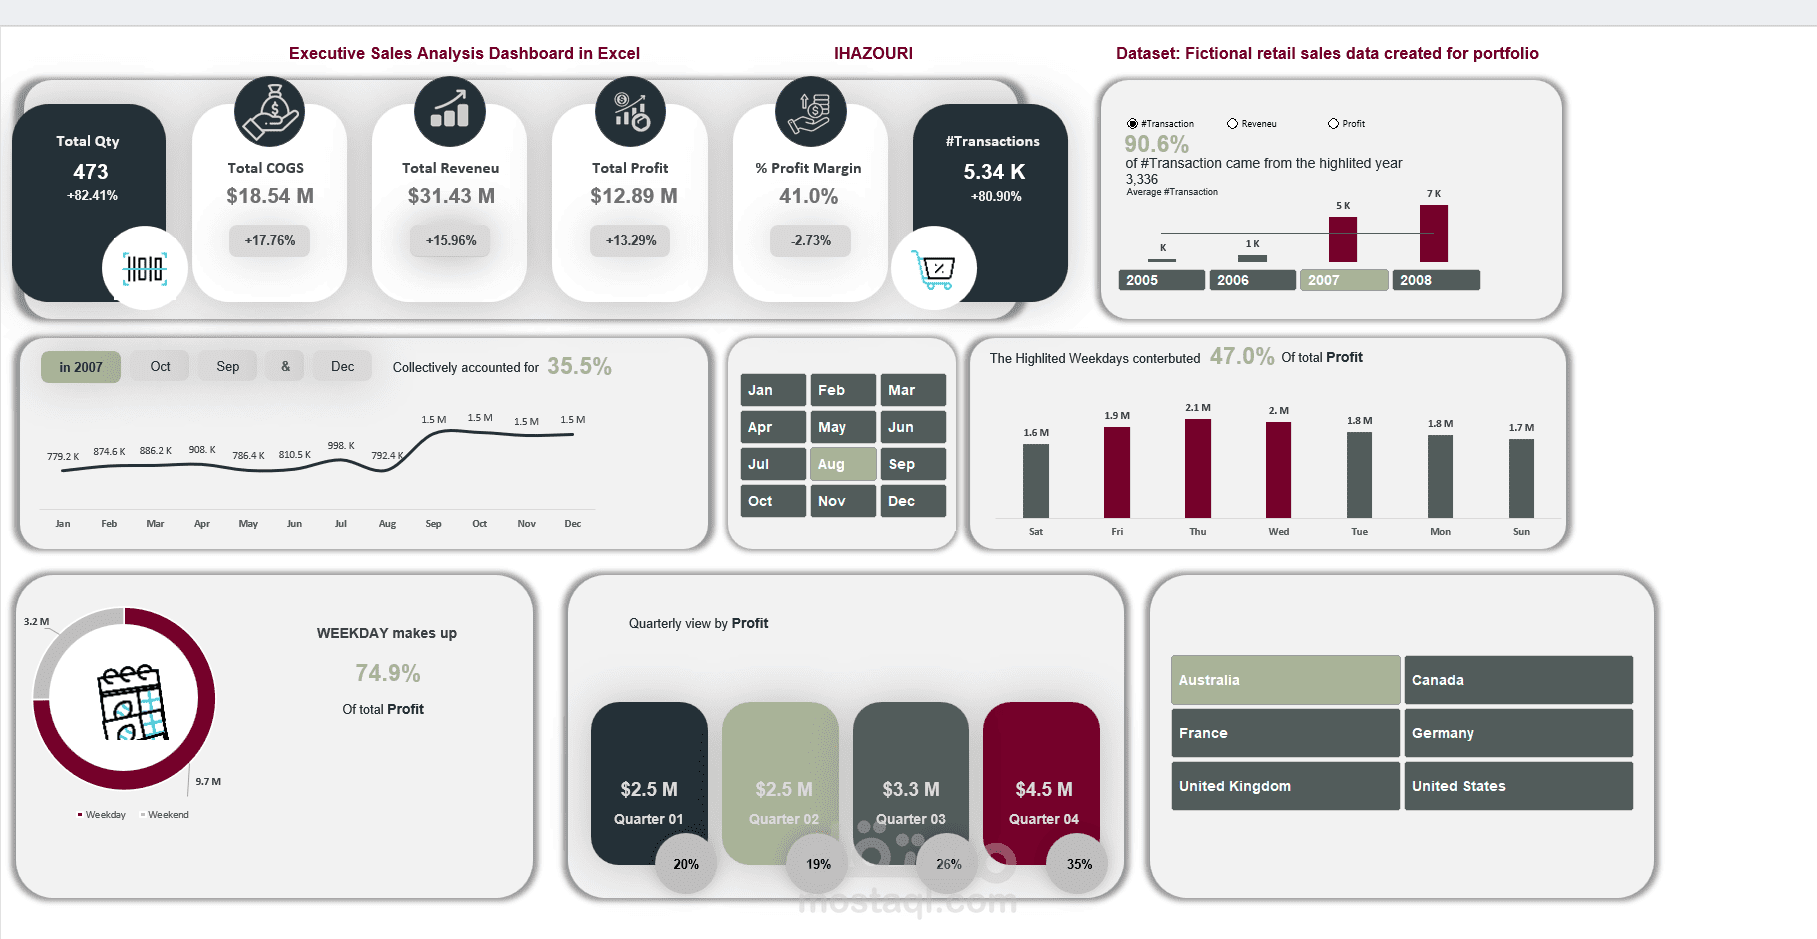
Designed and developed an interactive Excel dashboard to analyze sales performance, profitability, and business trends using a simulated retail dataset.
Key features:
Revenue, Profit, COGS, and Profit Margin KPIs
Year-over-Year (YoY) performance analysis
Interactive slicers and dynamic filtering
Quarterly, monthly, and weekday profitability insights
Transaction volume and sales quantity tracking
Executive-level business summary with actionable insights
Tools Used:
Microsoft Excel
Pivot Tables
Pivot Charts
Power Query
Advanced Excel Formulas
Dashboard Design & Data Visualization
Outcome: Created a management-focused dashboard that enables decision-makers to monitor business performance, identify profit drivers, and uncover sales trends through an intuitive and visually engaging interface.
Note: The dataset used in this project was created for portfolio and demonstration purposes.