Interactive Sales & Performance Dashboard in Excel
تفاصيل العمل
Project Title:
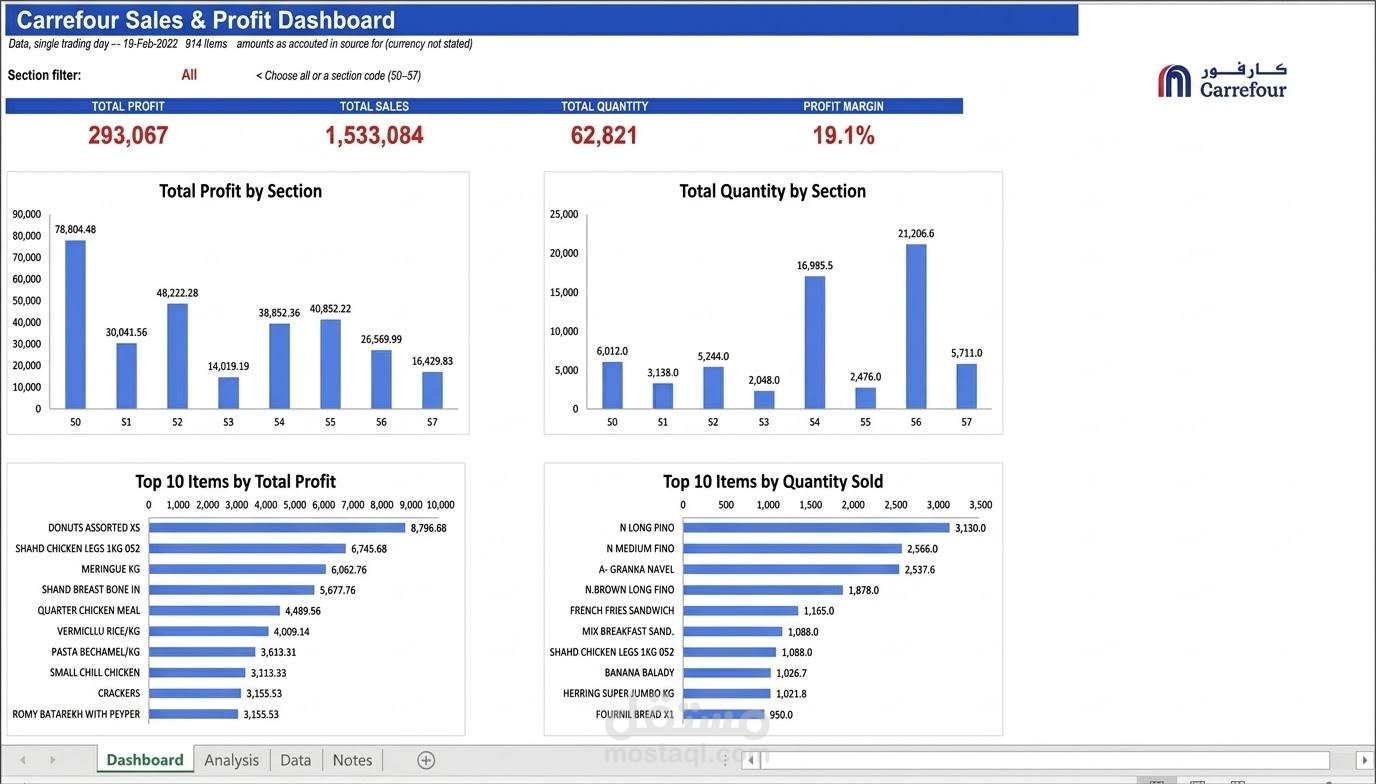
Interactive Sales & Performance Dashboard in Microsoft Excel
Project Description:
In this project, I transformed raw data into a clean, interactive, and modern Excel Dashboard to help management and decision-makers track key business metrics and gain actionable insights effortlessly.
Key Features & Components:
Key Performance Indicators (KPIs):
Total Revenue: Real-time tracking of overall sales with percentage growth indicators.
Total Profit: Clear breakdown of profit margins and financial performance.
Customer Acquisition: Monitoring new customer influx across selected periods.
Data Visualization & Analytics:
Top Selling Products: Comparative bar chart highlighting top-performing categories.
Monthly Sales Trend: Line chart visualizing sales trajectory over time (Q3 performance).
Sales Distribution by Region: Regional breakdown (North, South, East, West) using doughnut charts to analyze market share.
Dynamic Interactivity & Filtering:
Integrated Slicers/Filters allowing users to slice data seamlessly by Year, Quarter, and Product Category.
Tools & Techniques Used:
Microsoft Excel: Pivot Tables, Advanced Formulas, and Conditional Formatting.
Power Query: Data cleaning, transformation, and preparation.
Dashboard UX/UI Design: Modern dark-mode layout optimized for readability and professional reporting.