USA Car Accidents Analysis & Interactive Tableau Dashboard
تفاصيل العمل
Project Overview
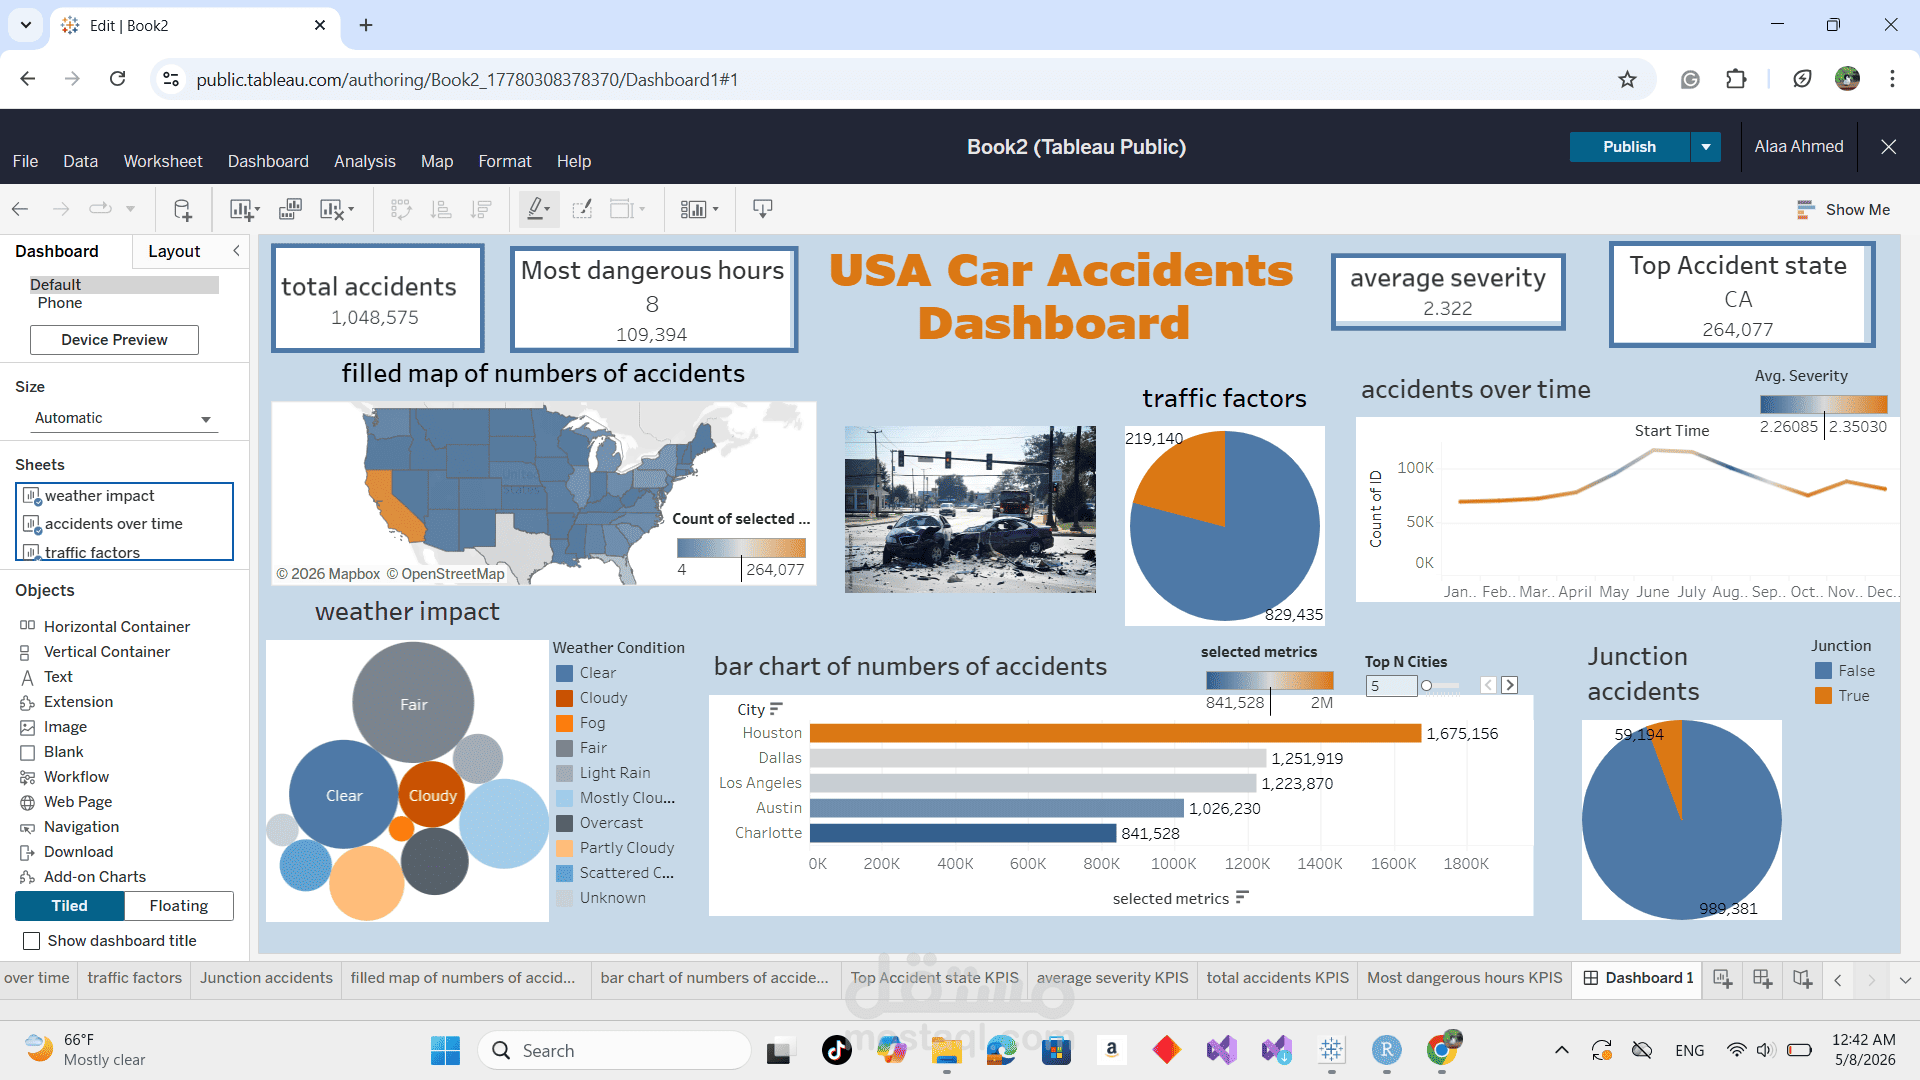
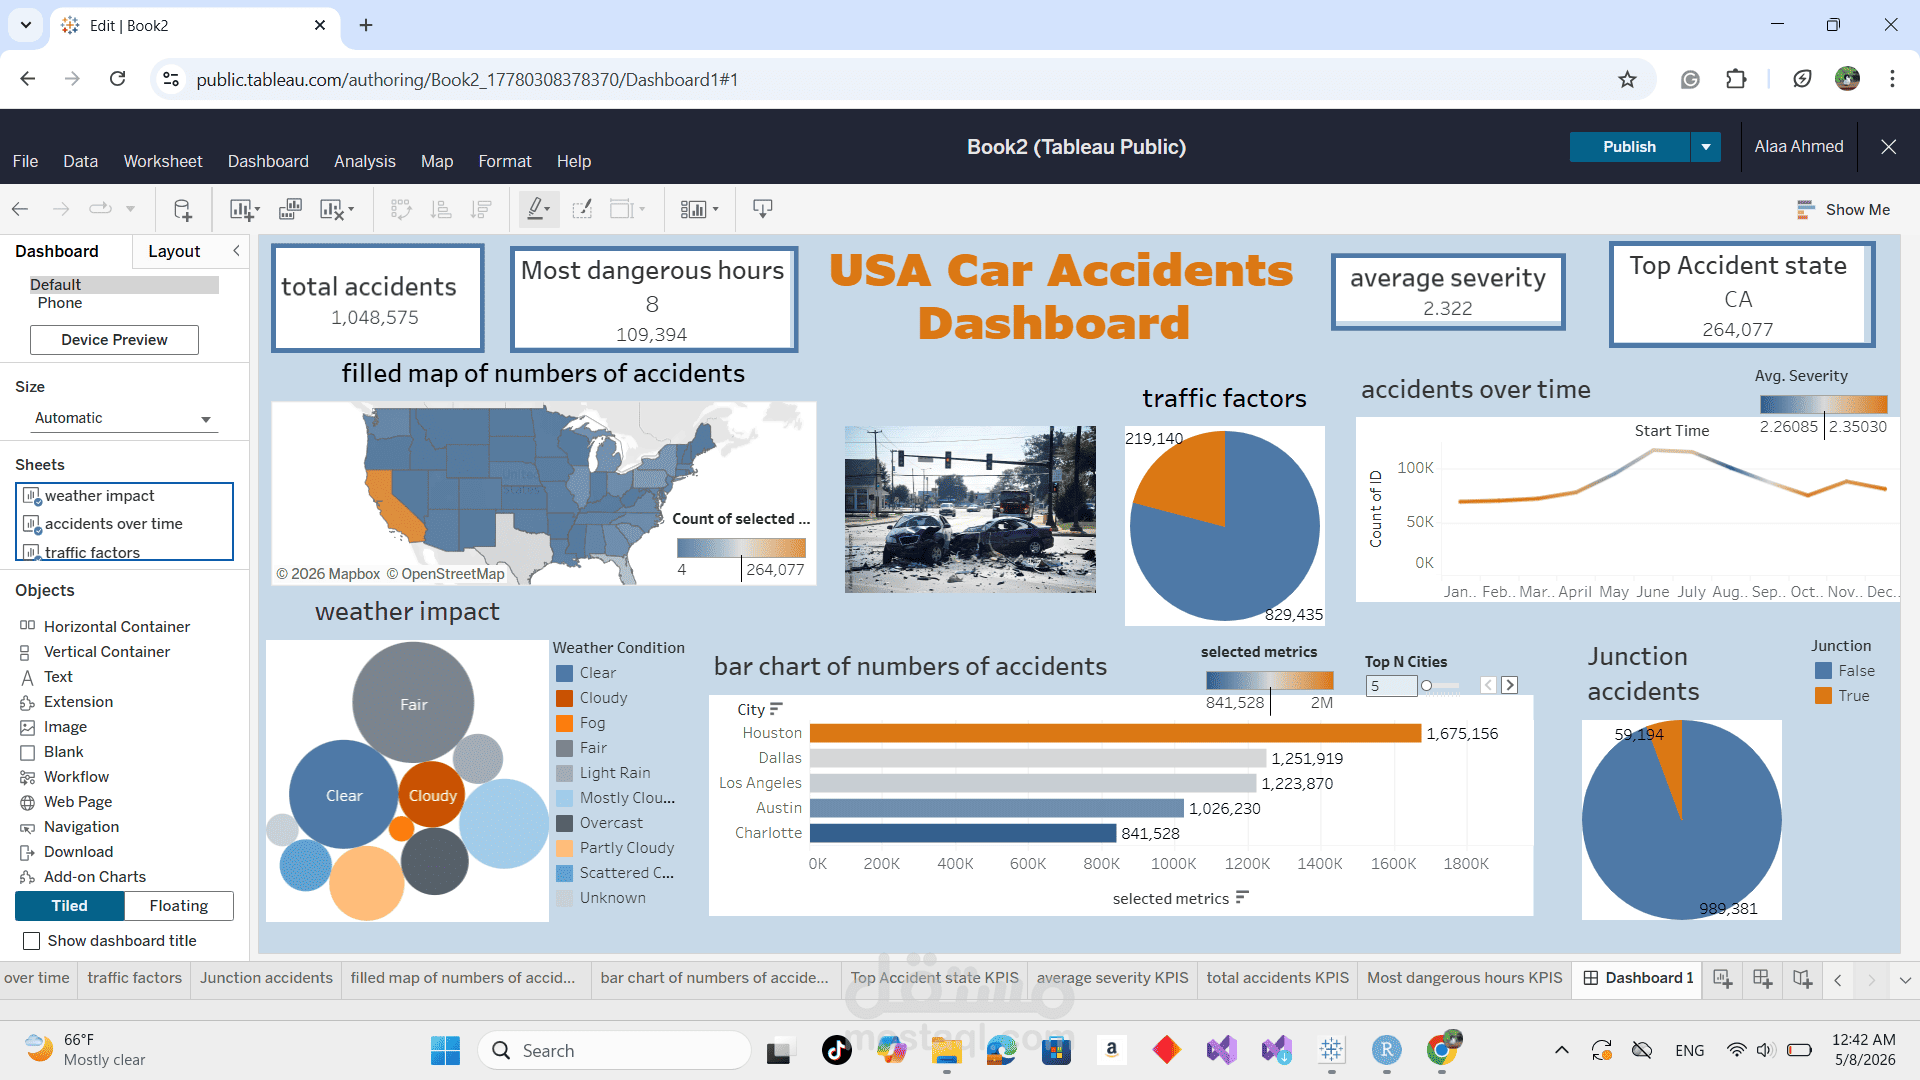
This project presents an interactive Tableau dashboard for analyzing car accidents across the United States. It transforms accident data into visual insights to explore accident distribution, severity, weather conditions, and temporal patterns.
Key Features
* KPI cards displaying total accidents and average severity.
* Geographic visualization of accident counts across US states.
* Analysis of accident trends over time.
* Comparison of accident counts across cities.
* Visualization of weather conditions and traffic-related factors.
* Interactive charts and filters for exploring accident data.
Tools & Technologies
Tableau Public, data visualization, and exploratory data analysis.
Project Objective
The objective is to make complex accident data easier to explore through an interactive dashboard that highlights geographic patterns, temporal trends, and potential factors associated with traffic accidents.
This project demonstrates practical skills in dashboard development, visual analytics, and data-driven storytelling.