Hotel Booking Performance Analysis Dashboard
تفاصيل العمل
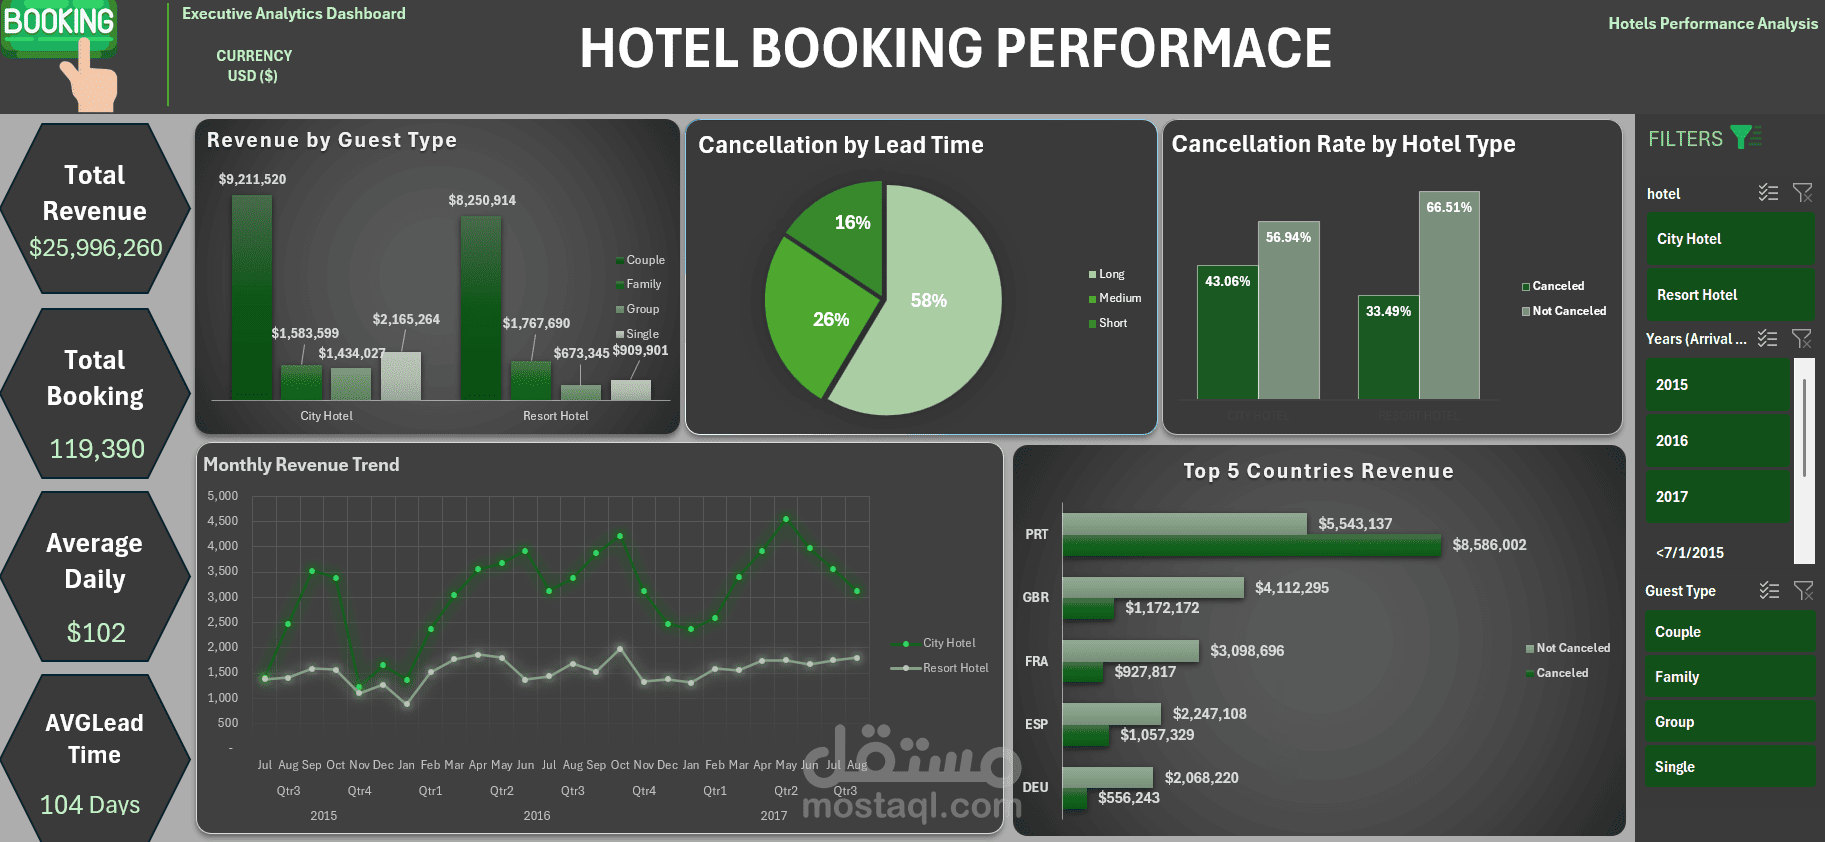
🏨 Hotel Booking Performance Analysis Dashboard
Author: Mohamed Saeed Mohamed Salem | Data Analyst
Tools & Technologies: Microsoft Excel (Power Query, Pivot Tables, Dynamic Slicers, Data Visualization)
📌 Project Overview
This project presents an interactive Executive Analytics Dashboard built to analyze overall hotel performance, revenue metrics, booking patterns, cancellation trends, and guest demographics across two main property types: City Hotel and Resort Hotel.
The project delivers key operational and financial insights to assist hotel management in optimizing pricing strategies, reducing cancellation rates, and targeting high-revenue guest segments.
📊 Key Performance Indicators (KPIs)
Total Revenue: $25,996,260
Total Bookings: 119,390 Bookings
Average Daily Rate (ADR): $102
Average Lead Time: 104 Days
💡 Core Insights & Highlights
Revenue Distribution by Guest Type:
Couples generate the dominant share of revenue for both City and Resort hotels (over $9.2M in City Hotel).
Families and Single Travelers follow, while Groups represent the smallest revenue segment.
Cancellation Analysis & Lead Time:
Cancellation Lead Time Distribution: Short lead times account for 58% of total cancellations, Medium accounts for 26%, and Long accounts for 16%.
Cancellation Rate by Hotel Type: City Hotels show higher overall cancellation rates compared to Resort Hotels.
Geographic & Monthly Trends:
Top Revenue Source Countries: Portugal (PRT) leads by a wide margin, followed by Great Britain (GBR), France (FRA), Spain (ESP), and Germany (DEU).
Seasonal Trend: Monthly revenue shows strong peak performance during summer quarters (Q2 & Q3) across both property types.
🖥️ Dashboard Interactive Features
Multi-Filter Slicers: Full dynamic filtering by Hotel Type (City Hotel / Resort Hotel), Years (2015, 2016, 2017), and Guest Types (Couple, Family, Group, Single).
Cross-Analysis Capabilities: Seamless visual updates to evaluate individual year performances or isolated target markets.