Northwind Transport,
تفاصيل العمل
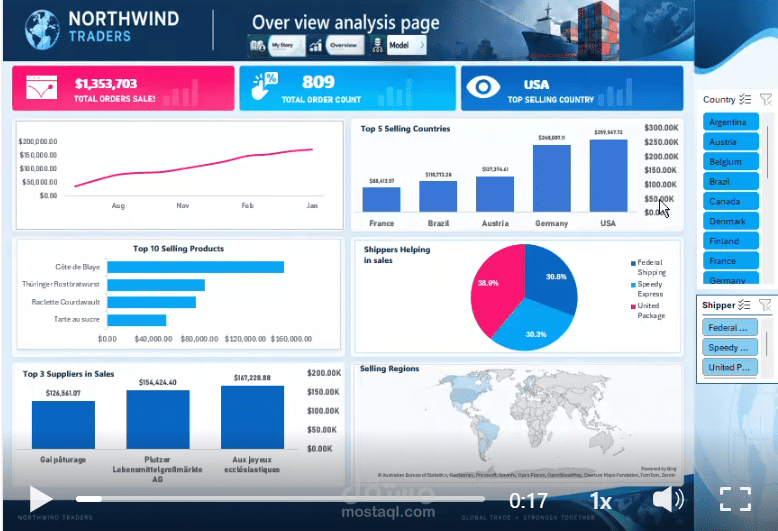
I’m excited to share my second project as part of my learning journey with National Telecommunication Institute (NTI). 🚀
For this project, I worked with Northwind Transport, analyzing how the company manages its products, suppliers, customers, employees, and operations across different regions.
The project took me through a complete data analytics workflow:
🔹 Data Extraction: Connected directly to the Northwind API using OData Feed — my first experience working with API data.
🔹 Data Cleaning & Transformation: Used Power Query to clean, transform, normalize the data, and create custom columns.
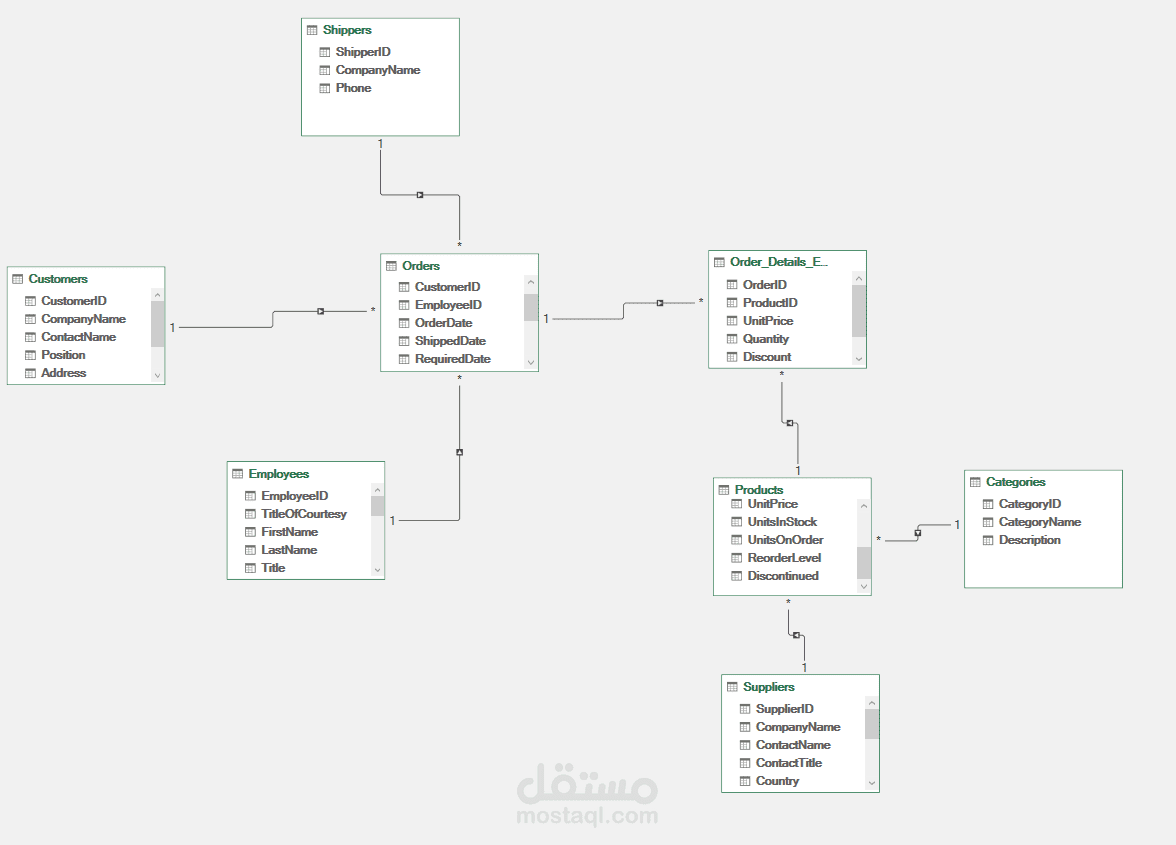
🔹 Data Modeling: Built a Snowflake Data Model and created relationships between the different tables using Power Pivot.
🔹 DAX: Created measures and calculations to support deeper analysis and generate meaningful KPIs.
🔹 Insights: Analyzed regions, cities, customers, and especially employee performance to identify areas that could help the business improve its operations and customer reach.
🔹 Data Visualization & Storytelling: Built 3 interactive pages:
📌 Overview
📌 Story
📌 Data Model