Netflix Dashboard | SQL Server + Power BI
تفاصيل العمل
Netflix Content Analytics Project
Project Overview
An end-to-end data analytics project covering the full data lifecycle — starting from raw, unclean data, through cleaning and transformation using SQL, and ending with an interactive Power BI dashboard showcasing key metrics and trends.
Dataset
A dataset of over 8,800 titles (movies and TV shows) from Netflix's content catalog, including: content type, release year, date added to the platform, production country, age rating, genre, director, and cast.
What Was Done
1. Data Cleaning with SQL Server
Detected and handled masked null values (N/A, Unknown, null, etc.) and standardized them into true NULLs
Standardized inconsistent text values (mixed casing, extra whitespace)
Removed duplicate records using Window Functions
Converted dates from multiple inconsistent text formats into a unified, real date type (using TRY_CONVERT and COALESCE)
Handled illogical values in numeric fields (invalid release years)
Split multi-value fields (countries, genres) into separate rows using STRING_SPLIT, enabling accurate per-value analysis
2. Power BI Dashboard
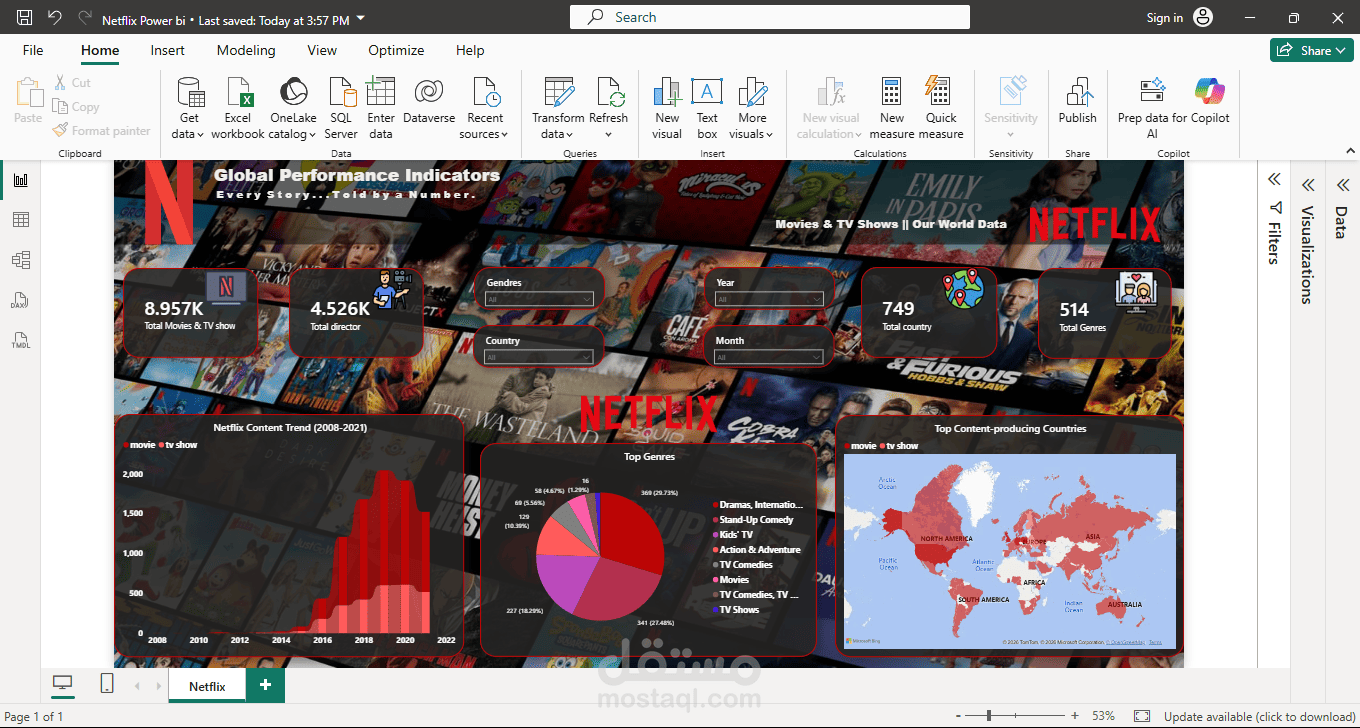
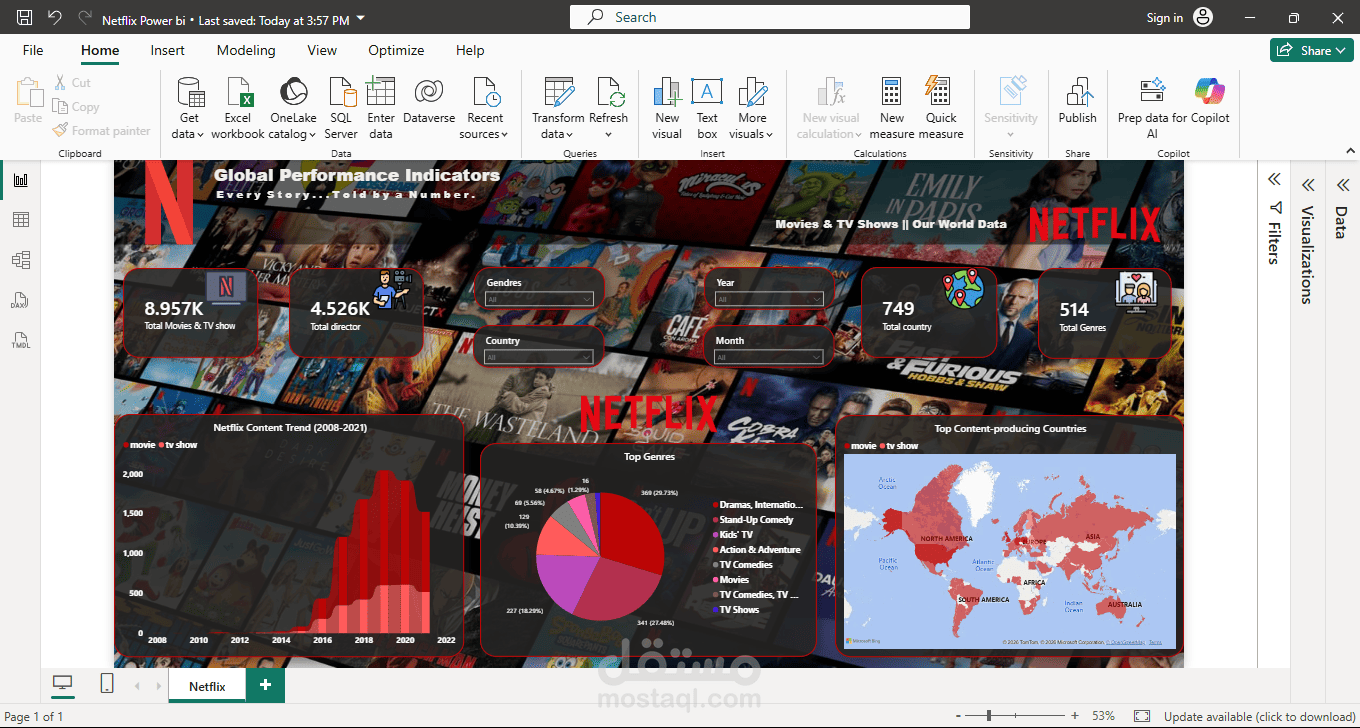
Key Performance Indicator (KPI) cards: total titles, total movies, total TV shows
Line chart showing content growth added to the platform over the years, broken down by type
Bar chart of the top 10 content-producing countries
Bar chart of the top 10 most common genres
Interactive filters allowing users to explore the data by content type
Tools Used
SQL Server / SSMS · Power BI · Data Cleaning & Transformation
Outcome
A ready-to-present interactive dashboard that enables decision-makers to understand content trends over time, and identify the top producing countries and genres, based on fully cleaned and reliable data.