Retail branch & product performance dashboard
تفاصيل العمل
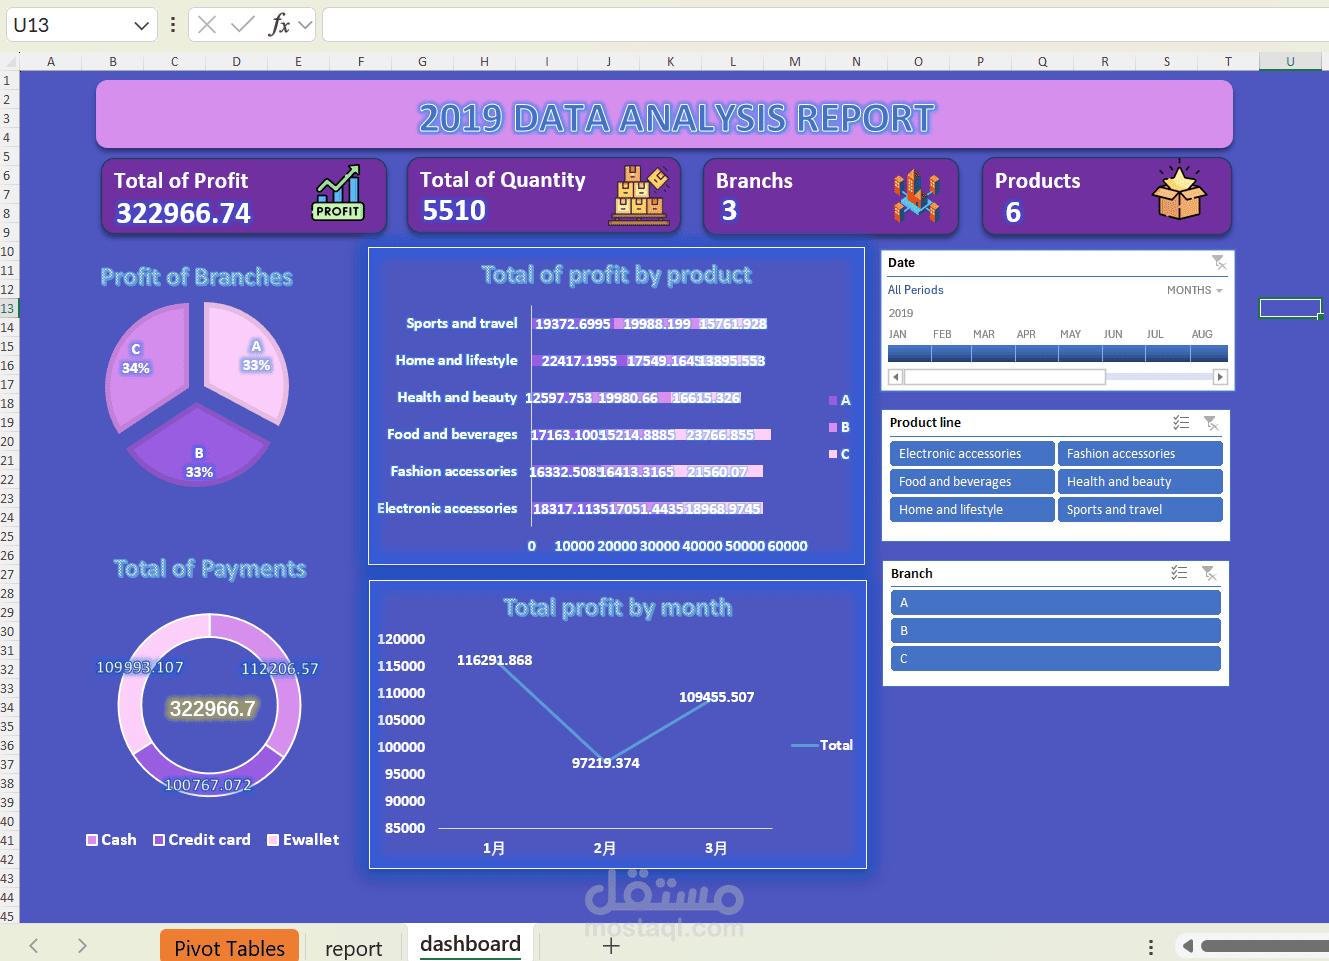
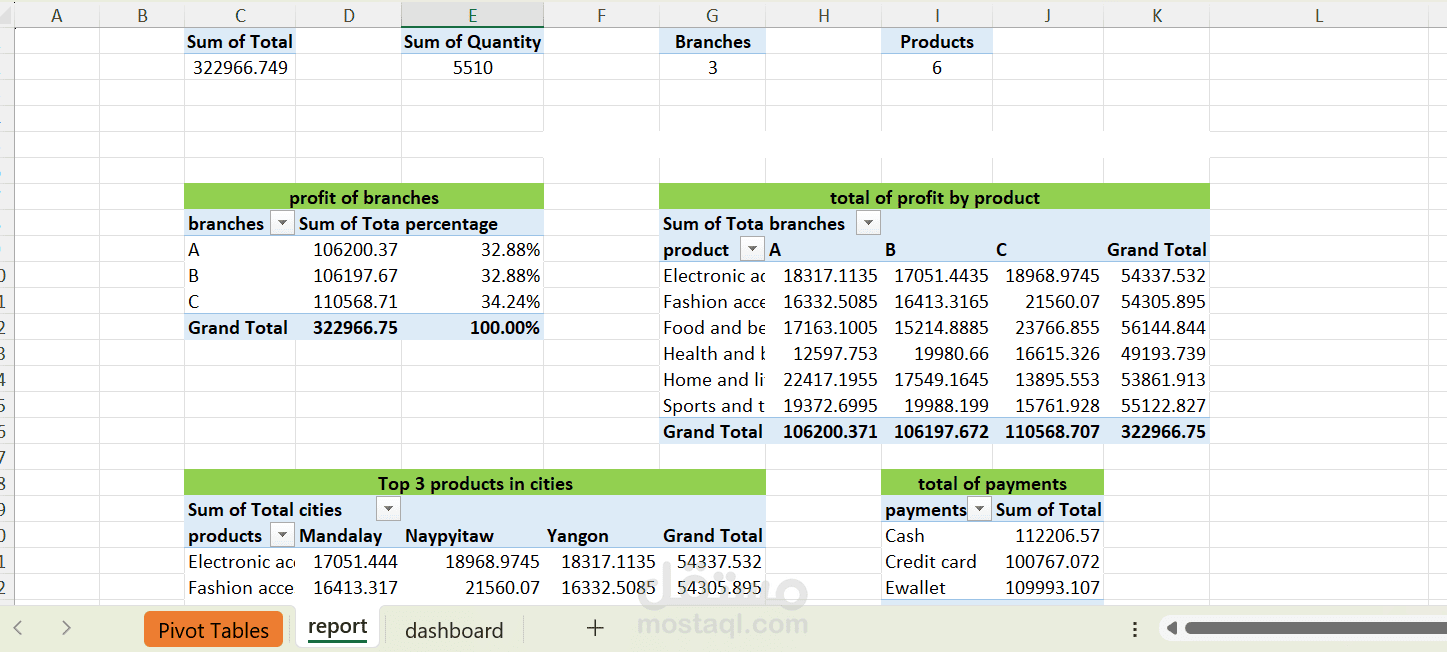
Analyzed a multi-branch retail dataset — 3 branches, 6 product lines, 3 cities — to build an interactive dashboard with KPI cards, branch profit share, payment-method mix, product-line profitability and month-over-month trend, backed by structured pivot tables.