Sales analytic
تفاصيل العمل
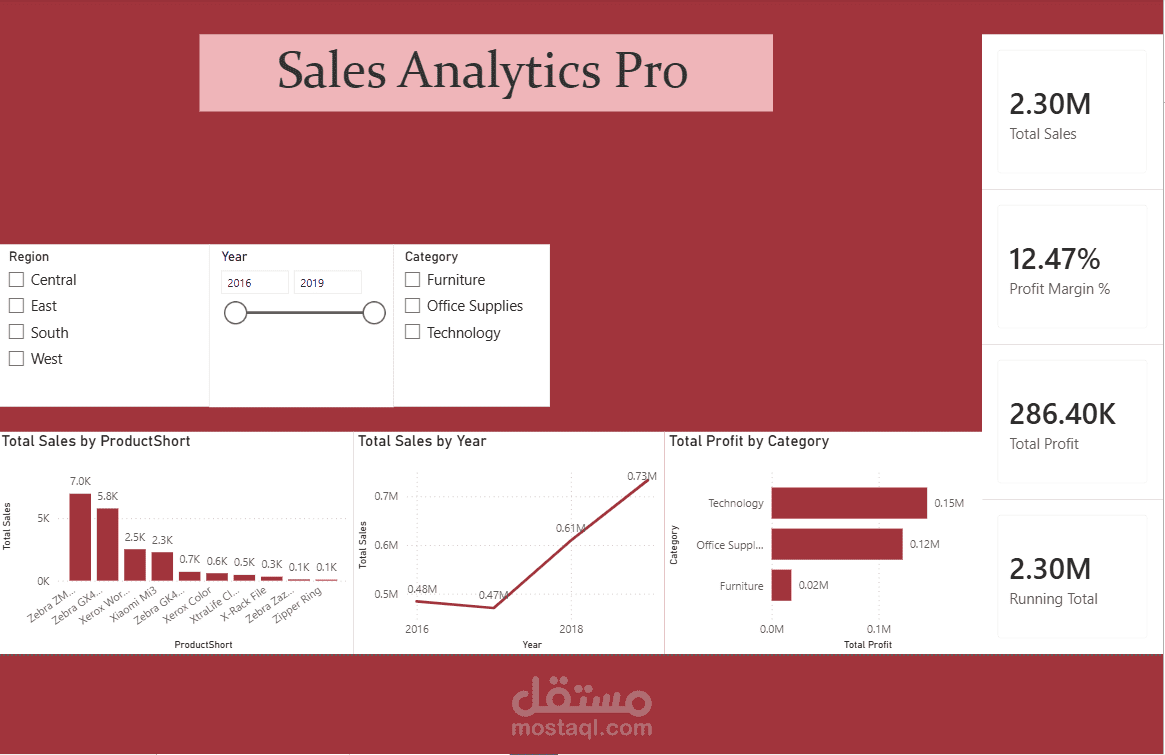
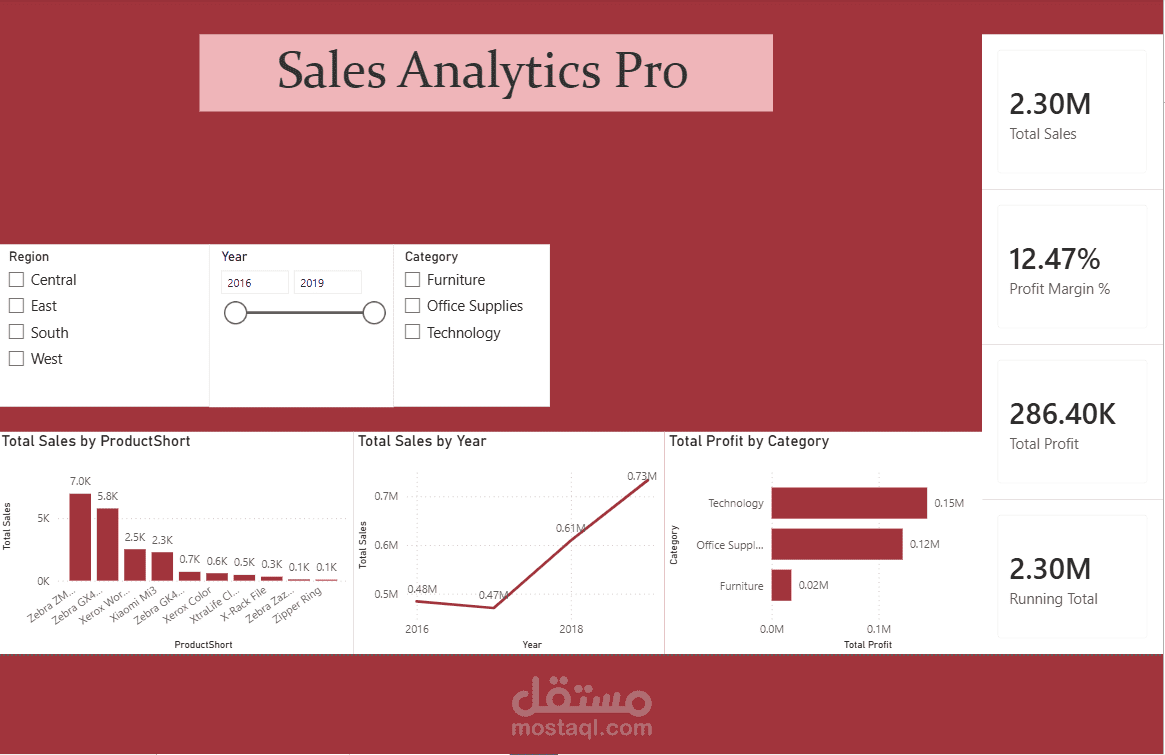
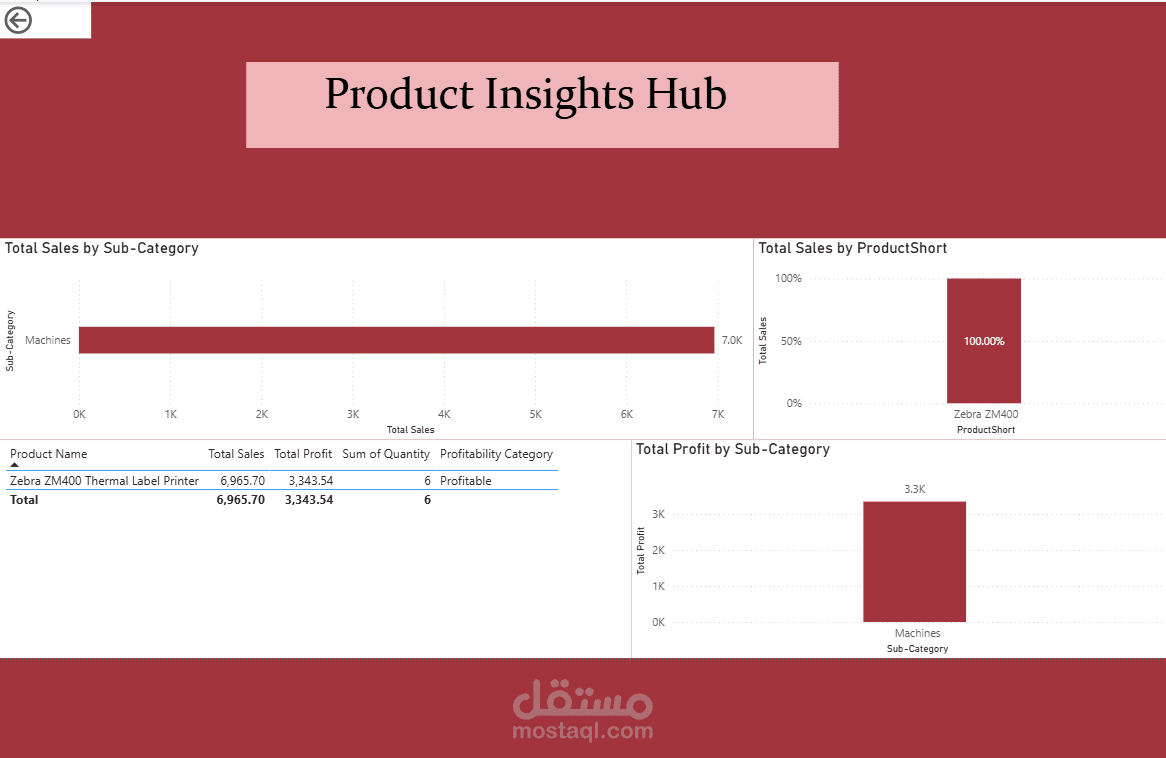
Sales & Product Analytics Dashboard – Power BI
A comprehensive Data Analytics project built using Excel and Power BI to analyze sales performance, profitability, and product insights.
Key Features:
Analyzing Total Sales, Total Profit, and Profit Margin.
Tracking sales performance by Year, Region, and Category.
Analyzing product and Sub-Category performance.
Identifying top-selling and profitable products.
Using interactive slicers for dynamic filtering.
Creating interactive dashboards and visualizations to turn raw data into clear business insights.
Tools: Excel | Power BI | DAX | Data Cleaning | Data Visualization