Superstore 2019 – Excel Data Analysis & Interactive Dashboard
تفاصيل العمل
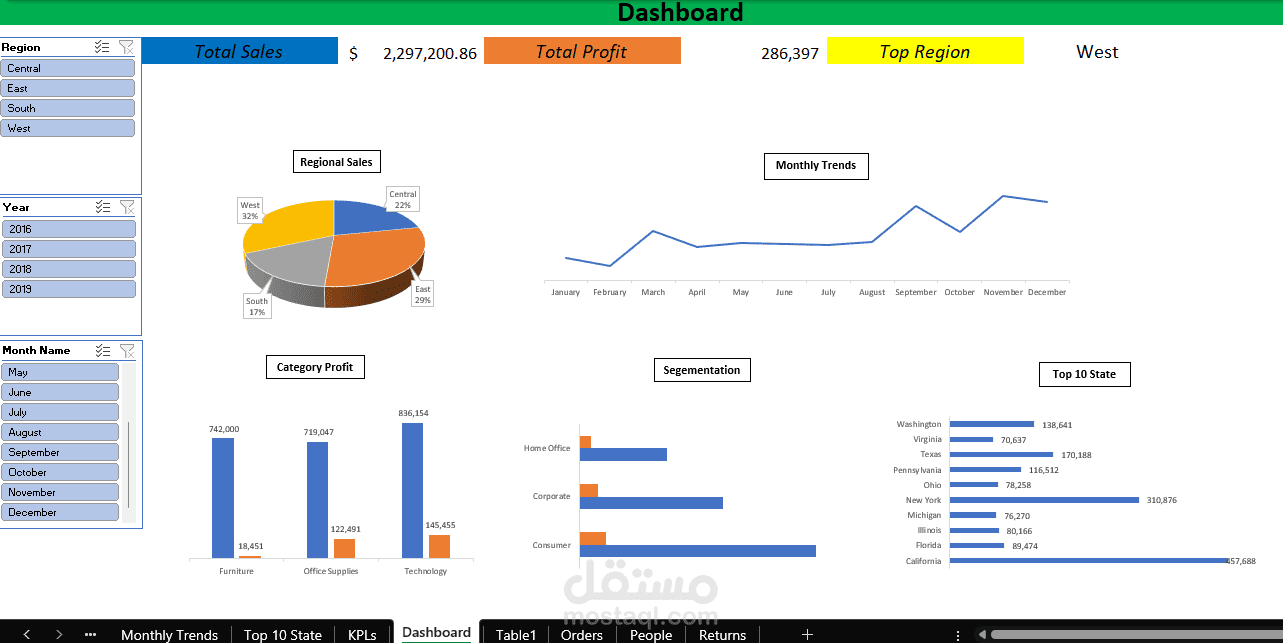
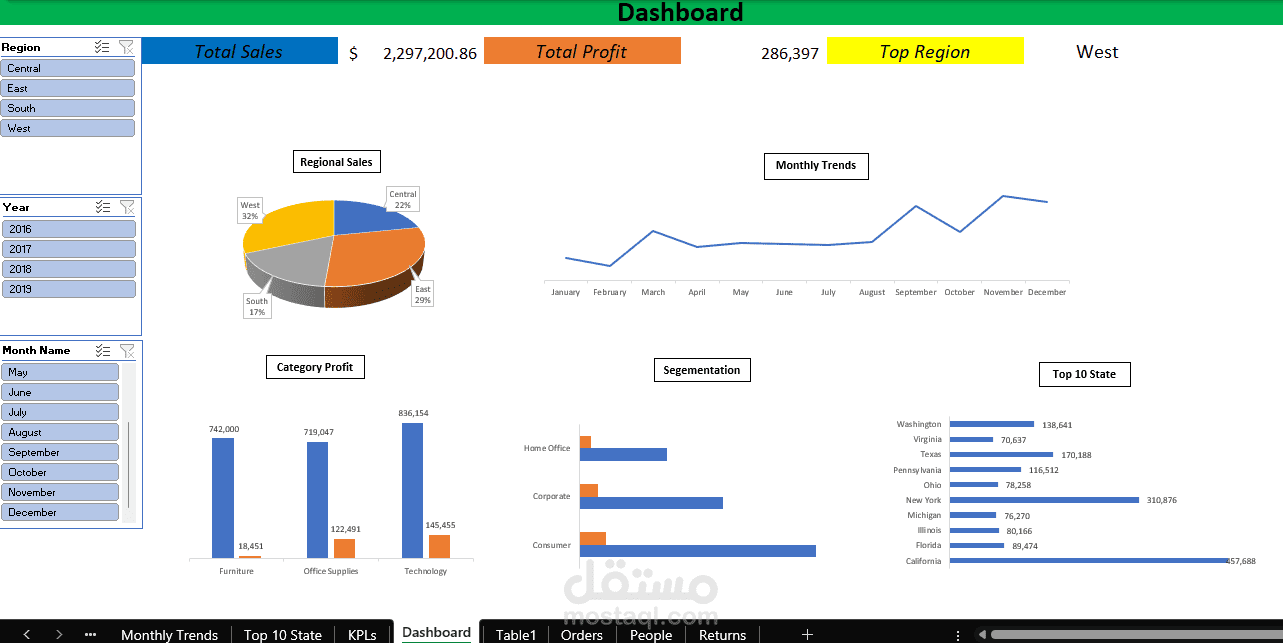
This project focuses on analyzing the Superstore 2019 dataset using Microsoft Excel, Power Query, and Pivot Tables to generate meaningful business insights.
The project includes:
- Data Cleaning: Using Power Query to remove duplicates, handle missing values, standardize category names, and correct data types.
- Calculated Columns: Creating calculated fields such as Profit Margin and Sales Category.
- Pivot Tables: Analyzing regional sales, category profitability, customer segments, and monthly sales trends.
- Data Visualization: Creating Pivot Charts, including line charts, column charts, and pie charts.
- Interactive Filtering: Adding slicers for Region, Segment, and Category.
- Interactive Dashboard: Designing a one-page management dashboard with KPI cards for Total Sales, Total Profit, and Top Region.
The main objective is to transform raw sales data into an interactive dashboard that helps monitor business performance and support data-driven decisions.