Sales and Profit Data Analysis Using Python
تفاصيل العمل
Sales and Profit Data Analysis Using Python
This project focuses on analyzing sales and profit data to identify key business insights and understand performance across different product categories.
Key Analysis:
Analyzed total sales and profit by product category.
Compared the performance of different product categories.
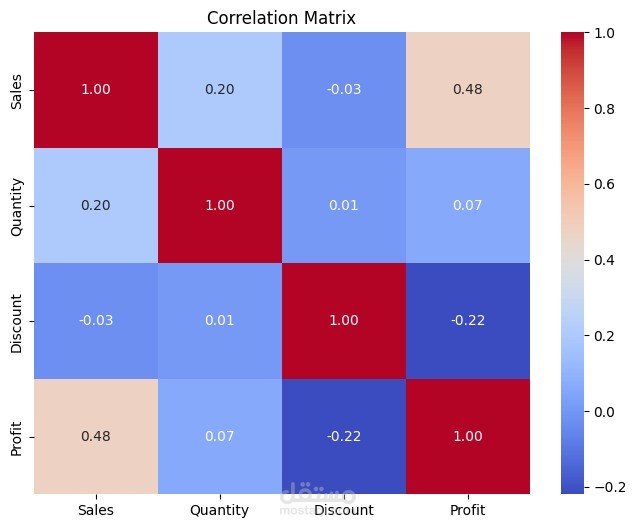
Examined the relationships between Sales, Profit, Quantity, and Discount using a correlation matrix.
Created clear and informative data visualizations to present the findings.
Tools & Technologies: Python, Pandas, NumPy, Matplotlib, Seaborn
The project demonstrates practical skills in data analysis, data visualization, statistical analysis, and extracting insights from business data.