Monthly Performance Review | Dashboard
تفاصيل العمل
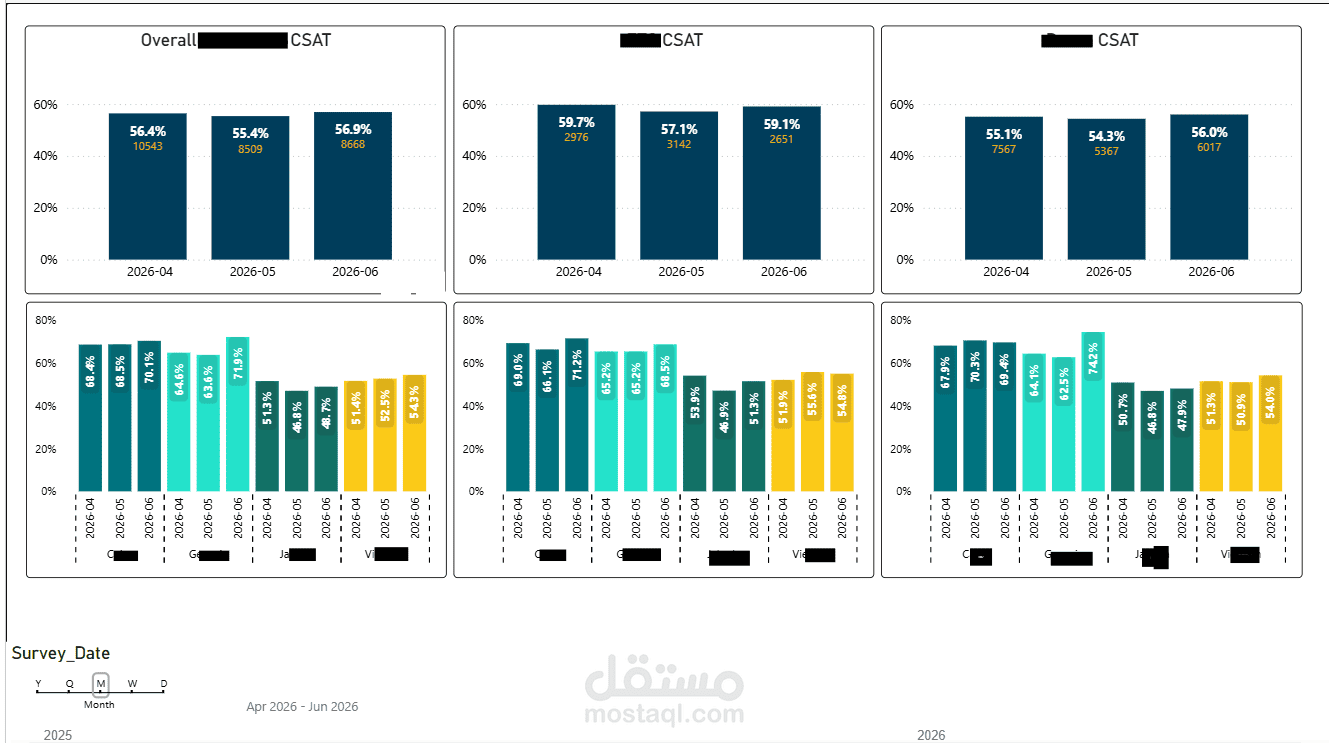
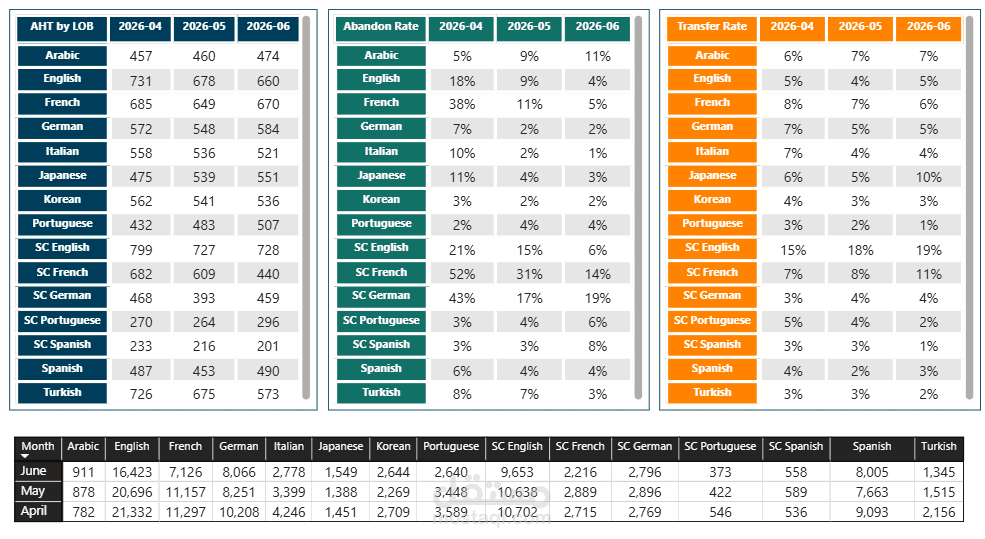
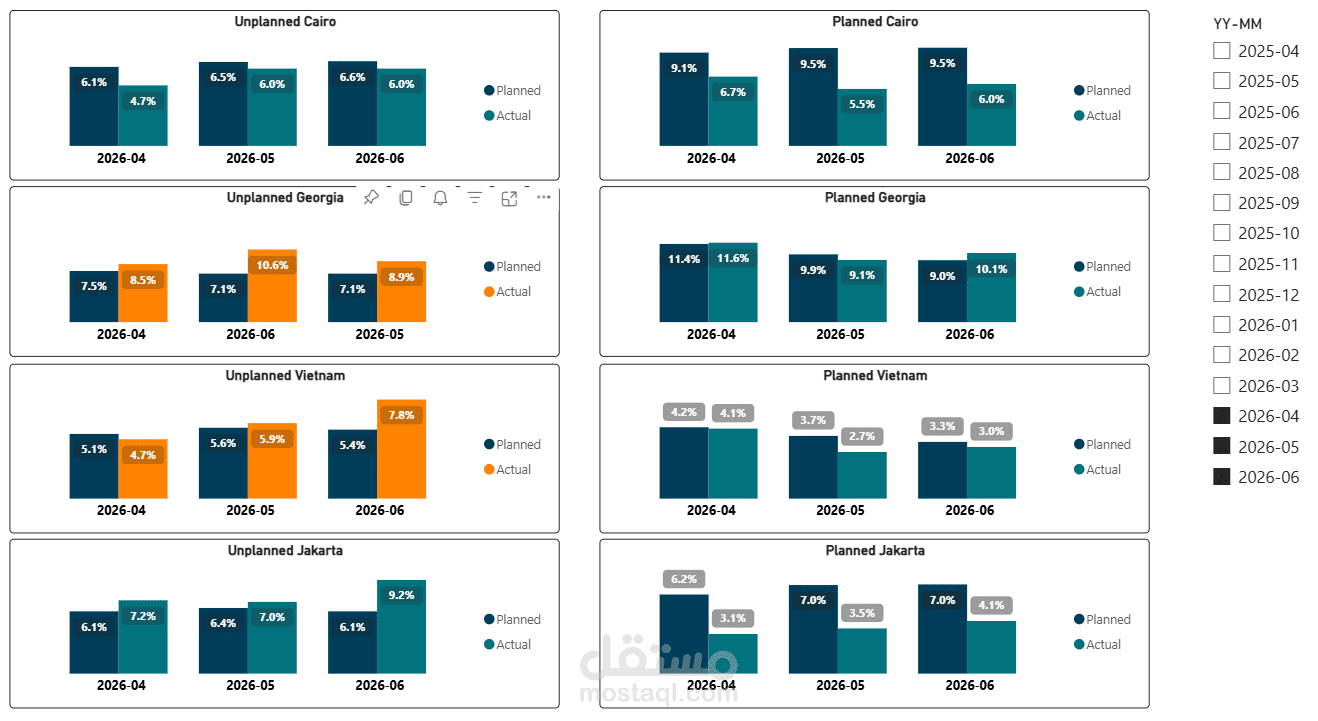
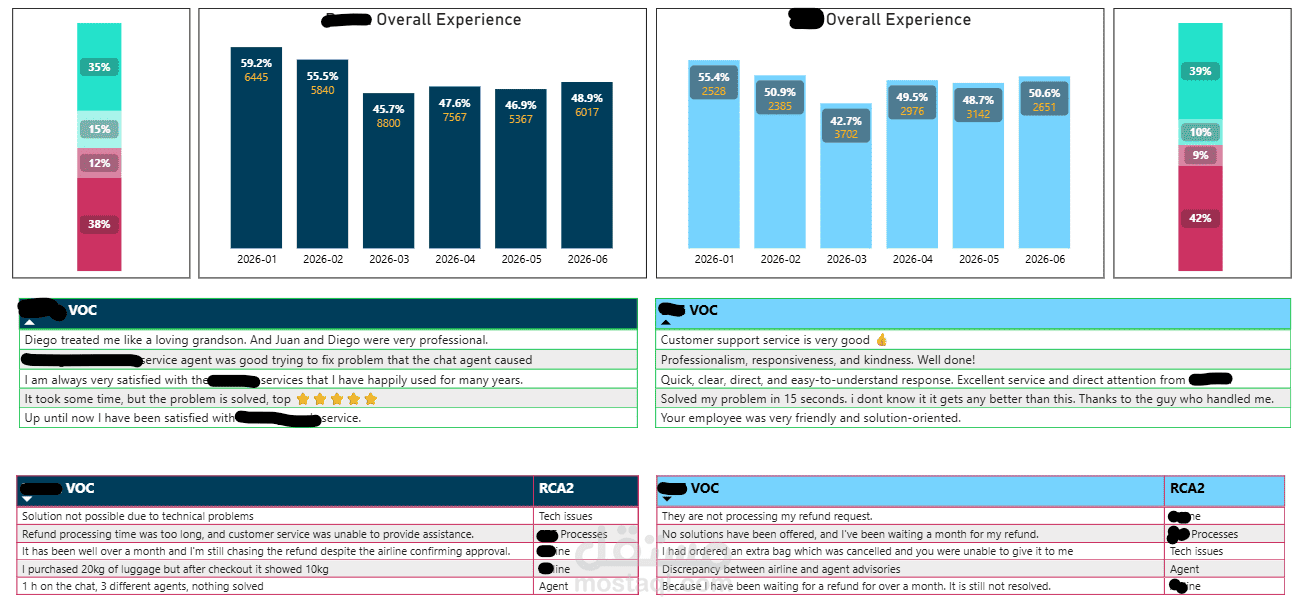
Designed and maintained a Monthly Performance Review Dashboard to provide a comprehensive view of operational and business performance. The dashboard consolidates key performance indicators (KPIs), trend analysis, and month-over-month comparisons into an interactive reporting solution that enables stakeholders to monitor performance, identify risks and opportunities, and make data-driven decisions. Responsibilities included data collection, transformation, validation, automation, visualization development, and performance analysis using Excel, Power BI, and Power Query.
Key Features:
Monthly KPI tracking and performance monitoring
Trend analysis and month-over-month comparisons
Interactive dashboards and executive-level reporting
Automated data extraction and report refresh
Performance variance and root-cause analysis
Data quality validation and governance
Actionable insights and recommendations for stakeholders
Tools Used: Excel, Power BI, Power Query.