Nile Wear Sales Performance KPIs & Dashboard
تفاصيل العمل
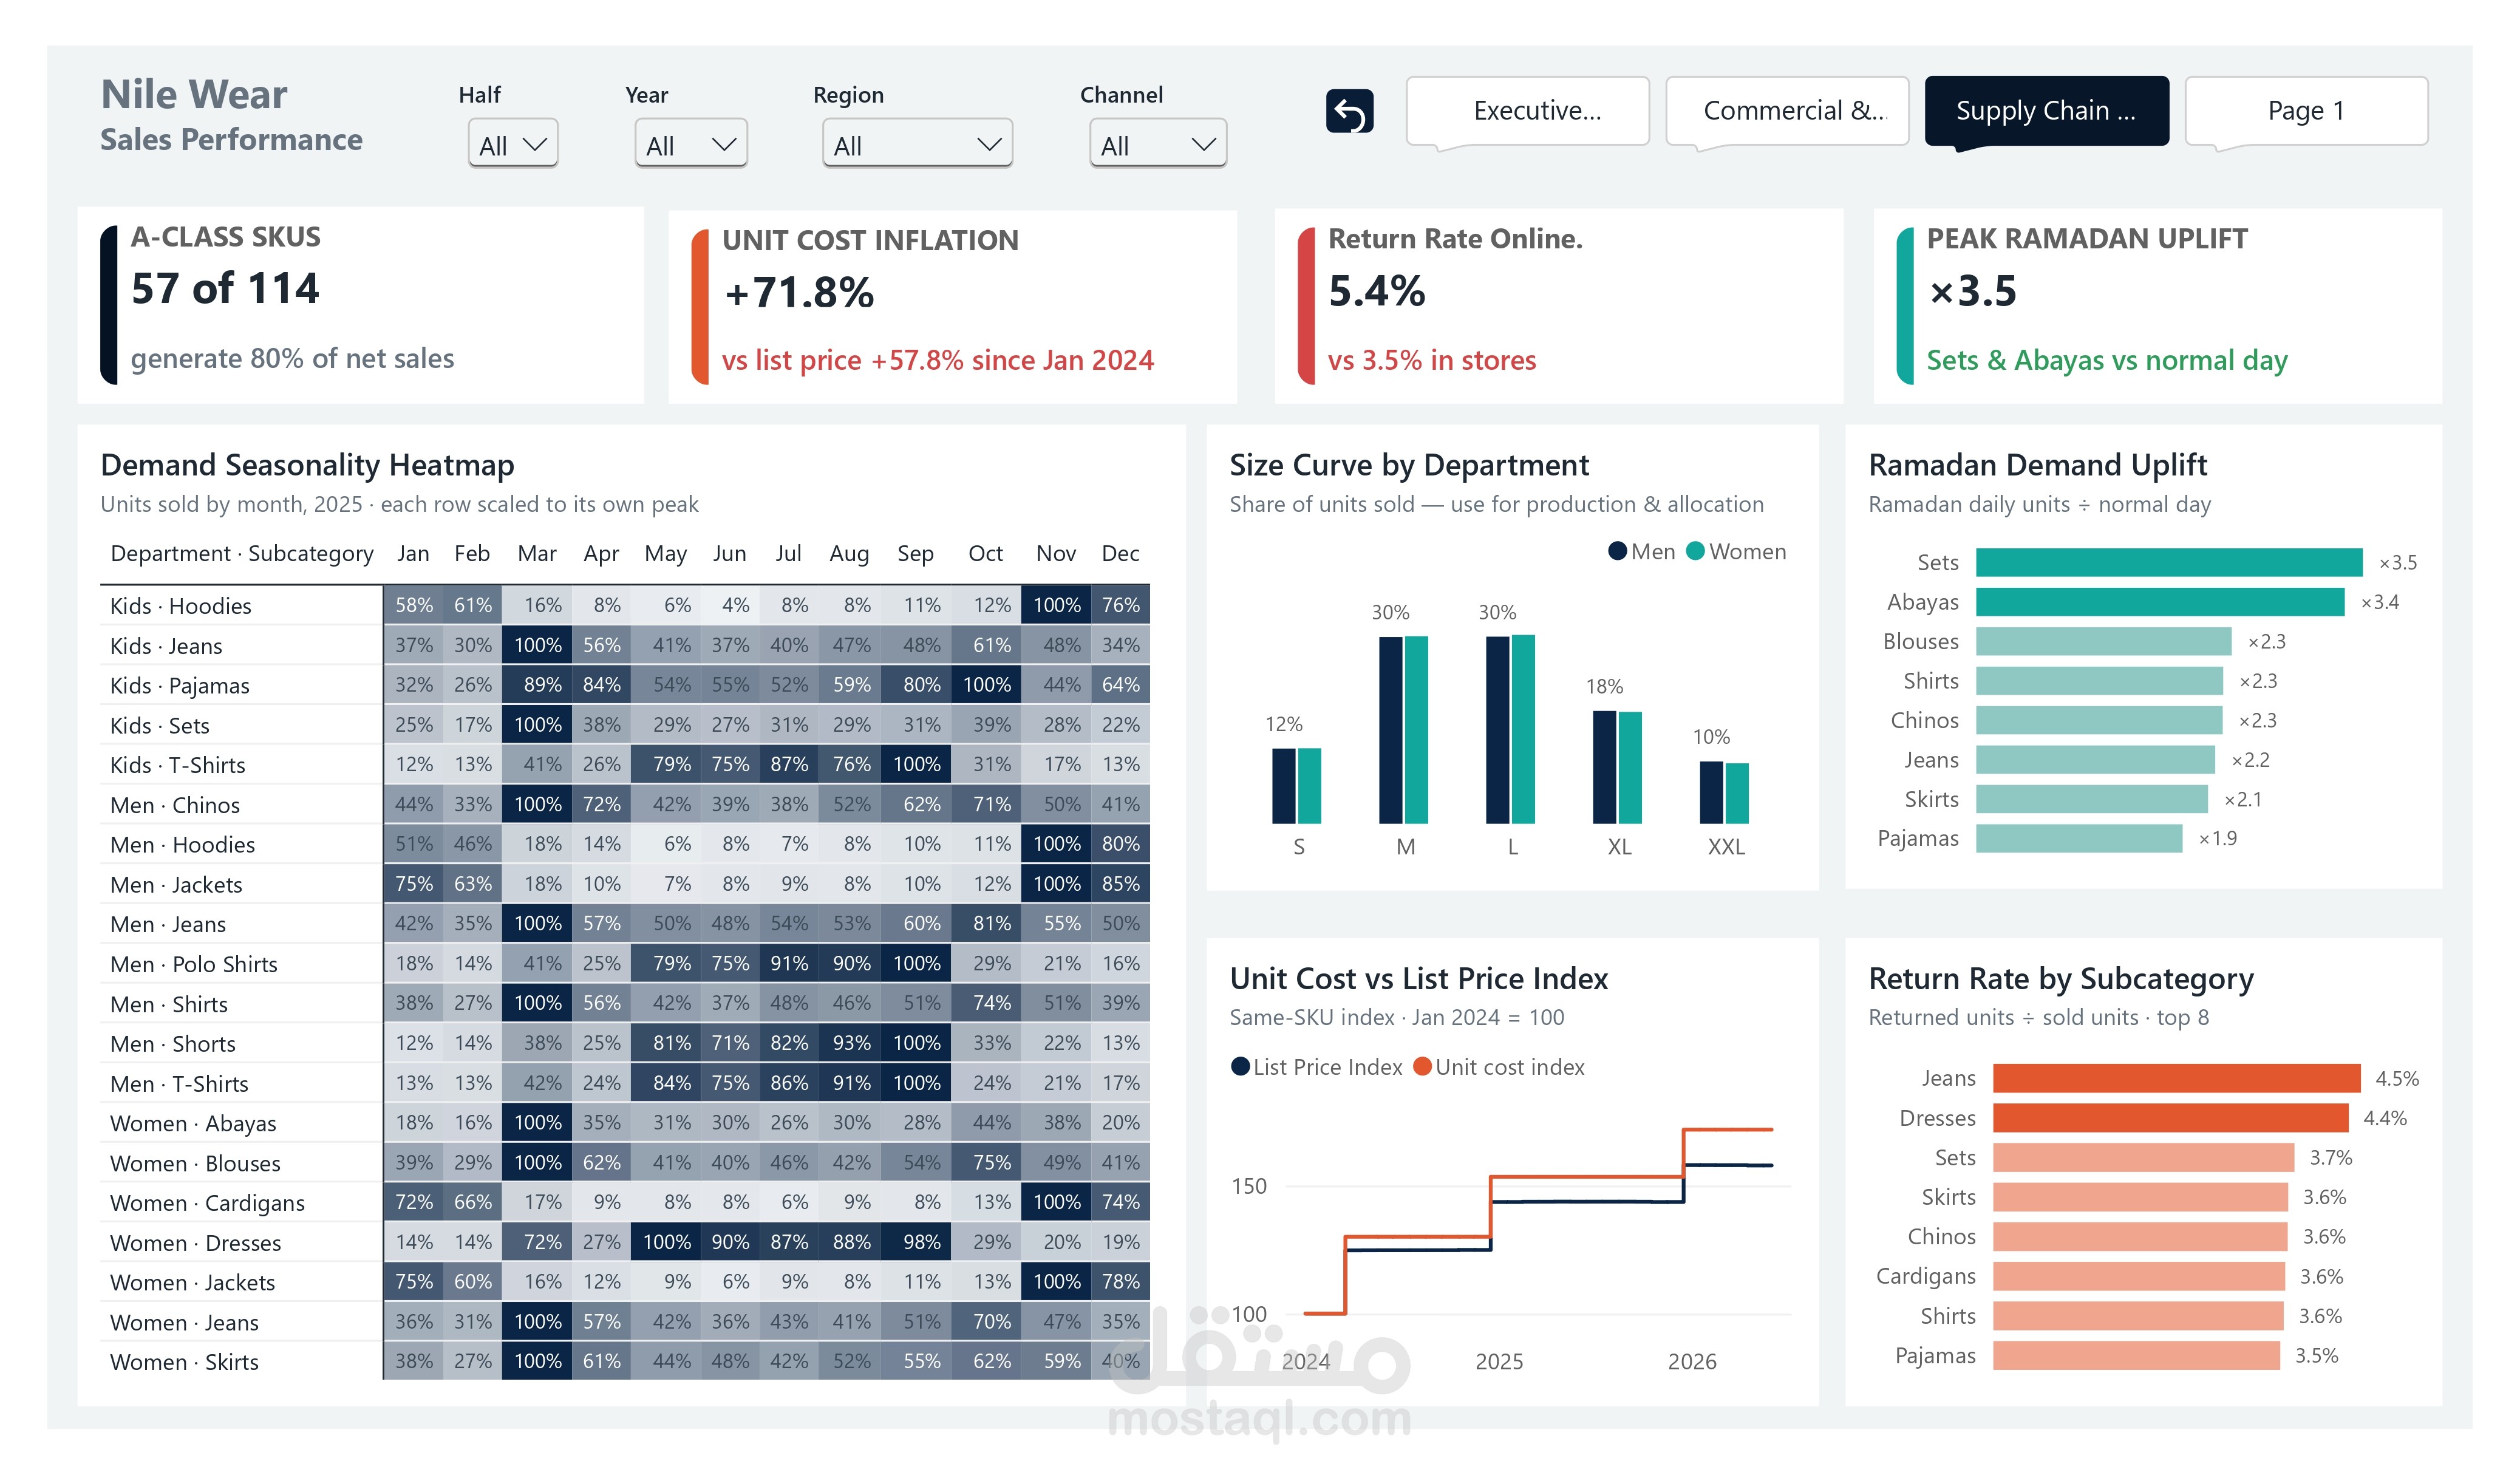
Nile Wear Sales Performance Dashboard
Overview
An end-to-end Power BI project for Nile Wear, a fictional Egyptian apparel chain with 12 stores across 8 governorates, a website and a social commerce channel. I took 30 months of raw sales data (January 2024 to June 2026), cleaned and modelled it, and built a three-page report. Each page answers the questions of a different audience: the CEO, the board and investors, and the supply chain team.
Business Problem
The company was growing fast, but management could not see clearly whether:
the growth was real or mostly driven by price increases,
profitability was keeping pace with sales,
stores and channels were on track against their targets,
production and stock were aligned with Egypt's seasonal demand, especially Ramadan, Eid, White Friday and back-to-school.
Data Preparation
Cleaned 175K+ raw transaction lines. This meant removing duplicates and test rows, standardising payment methods and product codes, fixing mixed date formats, and handling blank discounts and walk-in customers.
Built a star-schema model with two fact tables (Sales and Targets) and dimensions for Date, Product, Store, Customer and Size.
Created a custom date table flagging Egyptian retail events: Ramadan, both Eids, White Friday, back-to-school and the seasonal sales.
Report Pages
Executive Overview (CEO): KPI cards with dynamic year-over-year labels and colours, monthly sales vs target, regional performance, channel mix, a seasonal event index and a gross margin trend with a DAX regression line.
Commercial & Growth (Board): a waterfall that splits growth into volume and price effects, a store scorecard with conditional formatting, target achievement by store, new-store ramp-up curves and customer loyalty segments.
Supply Chain & Product: a demand seasonality heatmap, size curves for cut ratios, Ramadan demand uplift by category, a same-SKU cost vs price inflation index, ABC analysis and return rates by category.
Key Insights
Growth is real: net sales rose 36% (H1 2026 vs H1 2025). About 64% of the increase came from higher volume, and only 36% from price.
Margin is under pressure: since January 2024, unit costs rose 72% while list prices rose 58%. That gap cut gross margin by about 1 point, worth roughly EGP 0.65M per half-year.
Target gap: 12 of 14 stores and channels missed their targets, leaving a combined gap of EGP 2.1M.
Seasonality: Ramadan sells 1.65× a normal day, but Eid days themselves sell below normal. Customers buy before Eid, not during it.
Returns: online returns are 5.7% vs 3.5% in stores. They are concentrated in jeans, skirts and chinos, which points to a sizing and fit issue rather than a quality one.
Techniques Used
Power Query cleaning.
Star-schema modelling.
Time intelligence: SAMEPERIODLASTYEAR and YoY measures, with guards against invalid comparisons.
A volume/price bridge.
Cumulative ABC classification.
LINESTX trend lines.
Row-scaled heatmaps.
Measure-driven conditional formatting.
Sync slicers, bookmarks and page navigation.
Outcome
A decision-ready dashboard, backed by a 12-page written report with quantified improvement opportunities. The main recommendation is to restore the margin to its 2025 level and close the target gap, which together are worth about EGP 3.4M in gross profit per year.