📊 Electronic Sales Report 2025 | Power BI Project
تفاصيل العمل
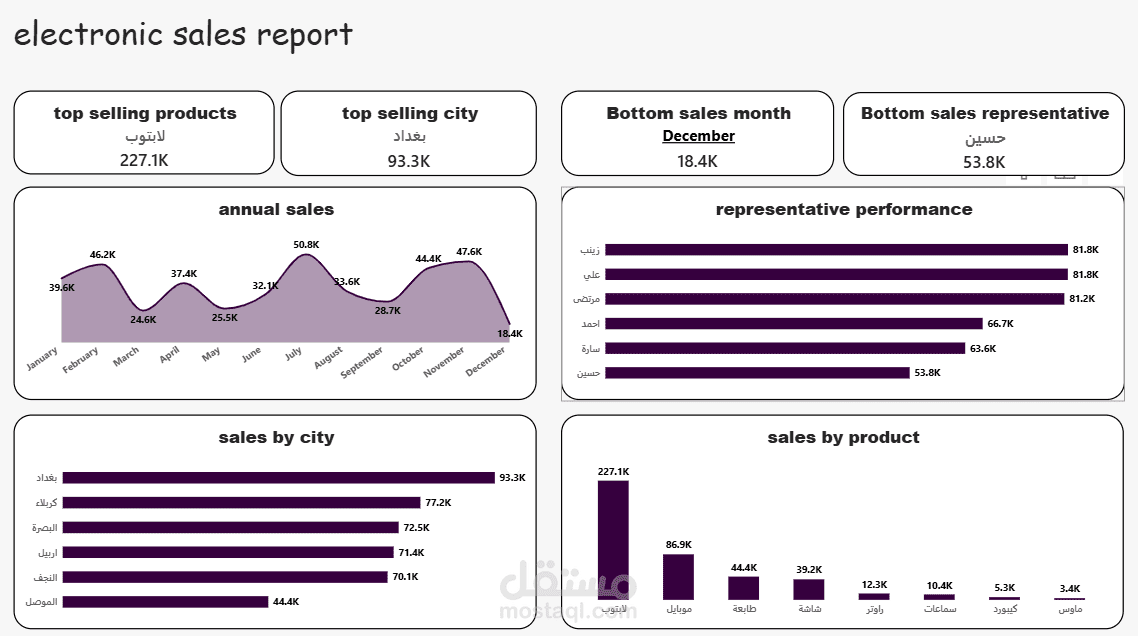
built this dashboard to answer three questions for a store manager: which products and cities drive revenue, how sales trend across the year, and which sales rep is underperforming.
Data cleaning (Power Query):
Removed duplicate orders
Standardized city, product, and rep names (spelling variants and extra spaces)
Recovered missing Qty and negative prices using Total = Qty × Price × (1 − Discount)
Key insights:
Laptops generate 227K, more than half of total sales (429K)
Baghdad leads all cities with 93K, while Mosul is the weakest at 44K
July is the peak month (50.8K), and December is the lowest (18.4K)
Top reps (Zainab, Ali) outsell the lowest rep (Hussein) by about 50%
Tools: Power BI, Power Query, DAX
This is project 1 of a series of small projects I'm publishing as I build my portfolio. Feedback is welcome 🙏