Seoudi Orders Analysis Dashboard | Power BI
تفاصيل العمل
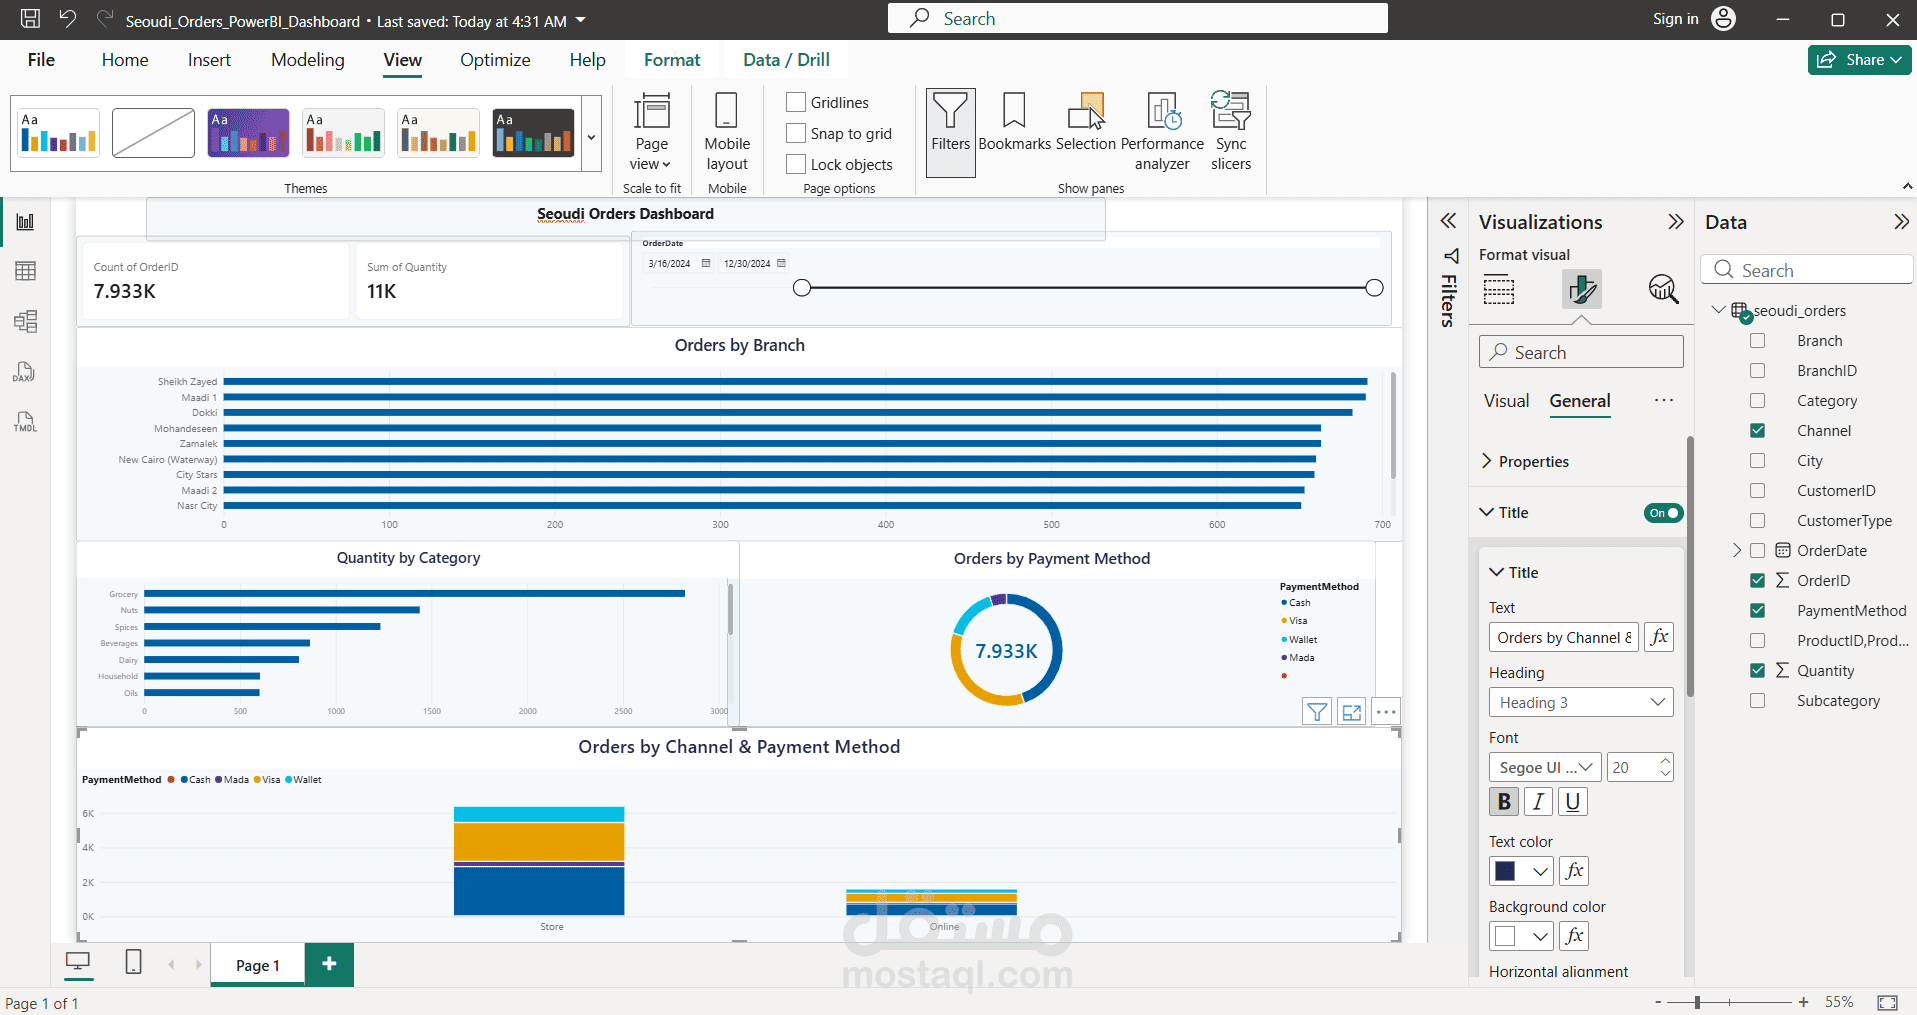
Developed an interactive Power BI dashboard to analyze Seoudi supermarket orders and provide a clear overview of order performance.
The dashboard includes:
• Total Orders and Total Quantity KPIs
• Orders by Branch
• Quantity by Category
• Orders by Payment Method
• Orders by Sales Channel
• Payment Method analysis across different sales channels
• Interactive Order Date filtering
The dashboard was designed with a clean and organized layout to make order data easy to understand and support data-driven business insights.
Tools:
Microsoft Power BI
Data Analysis
Data Visualization
Dashboard Design