Interactive Sales Dashboard Using Power BI
تفاصيل العمل
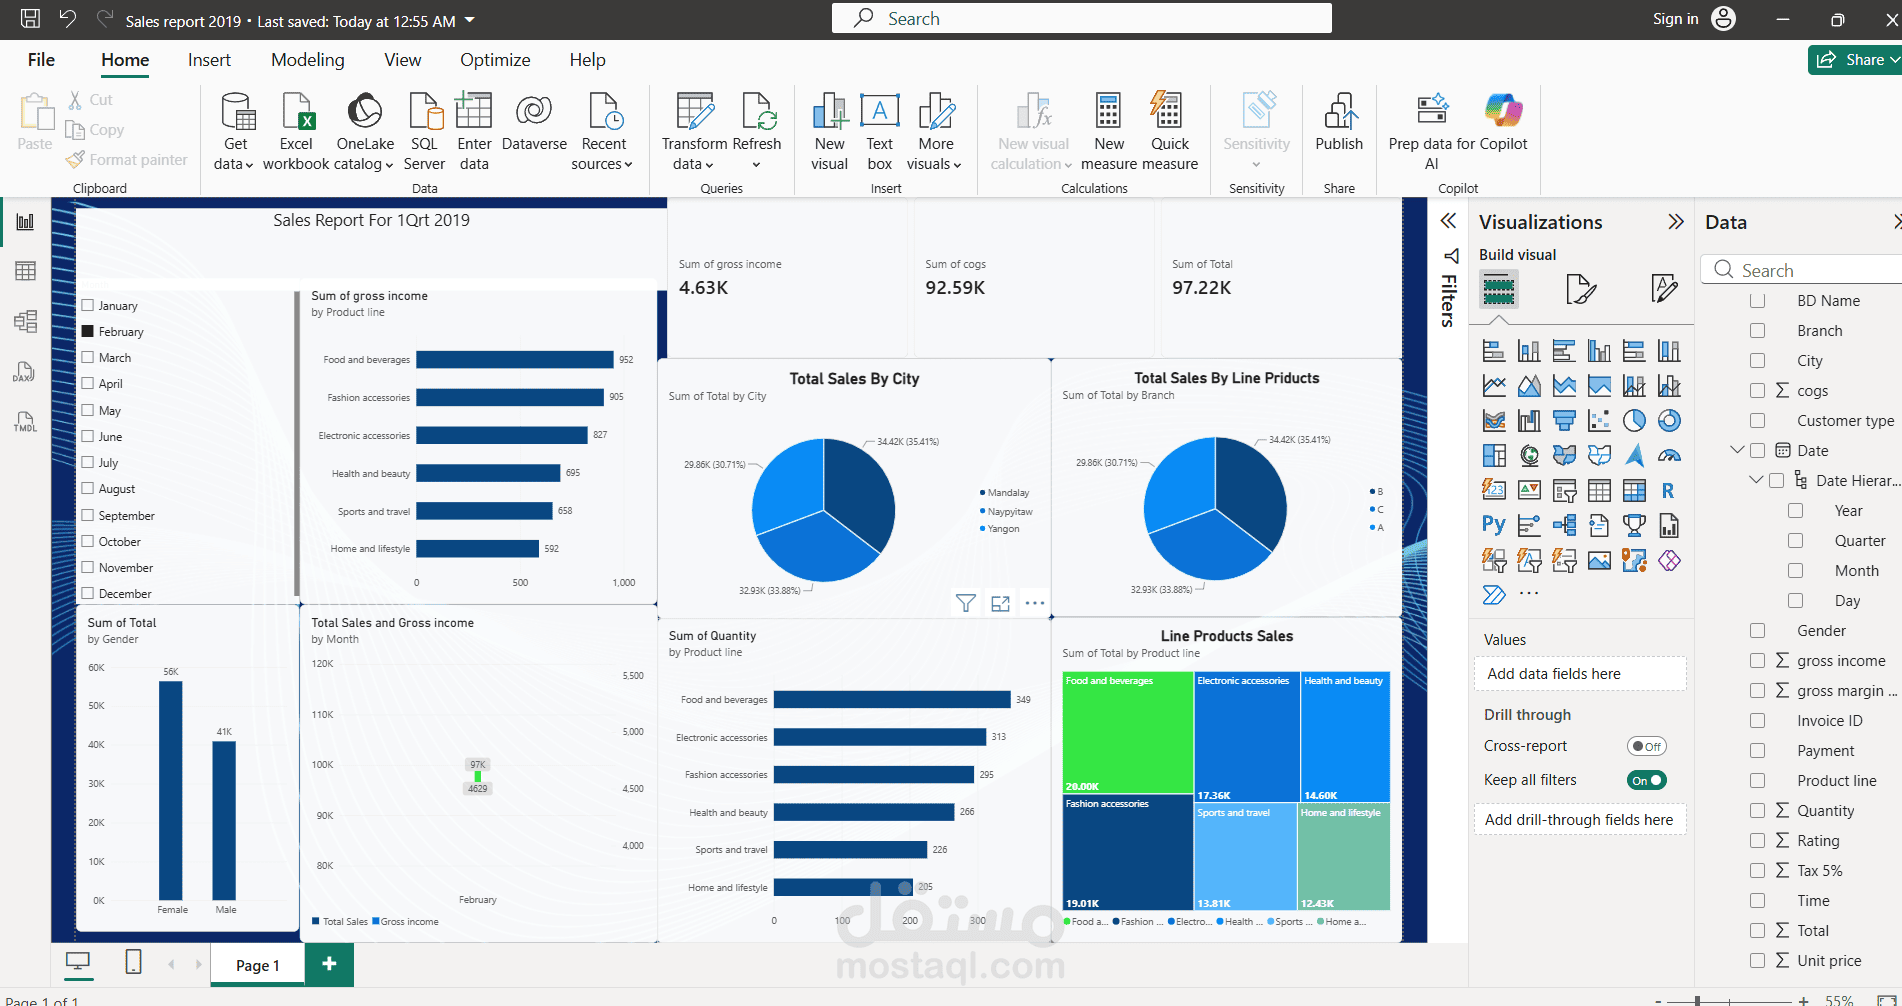
Designed an interactive Power BI dashboard to analyze sales performance, including total sales, gross income, COGS, product lines, branches, cities, monthly trends, and customer demographics. The dashboard uses interactive filters and visualizations to present key business insights in a clear and organized way.