Adidas Dashboard
تفاصيل العمل
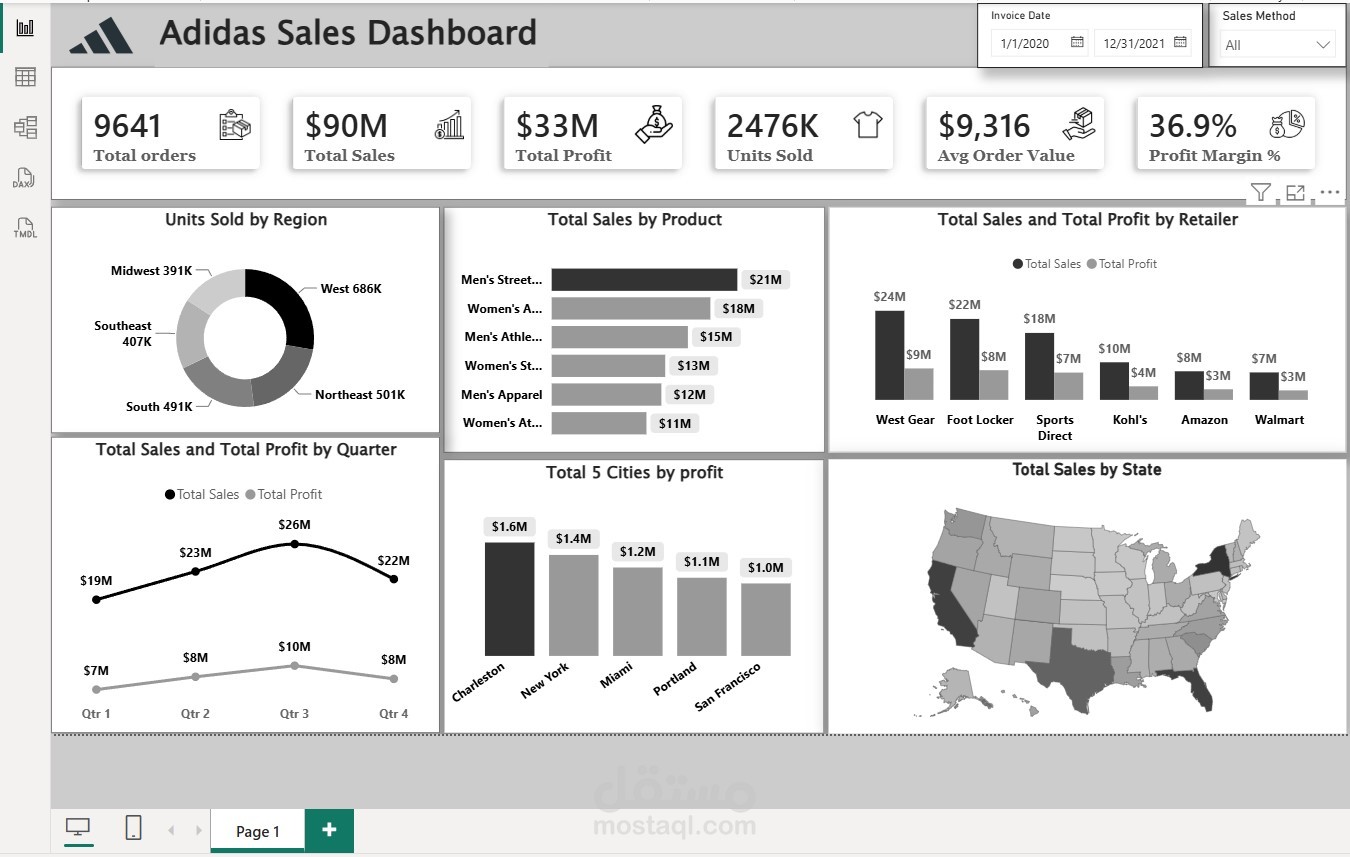
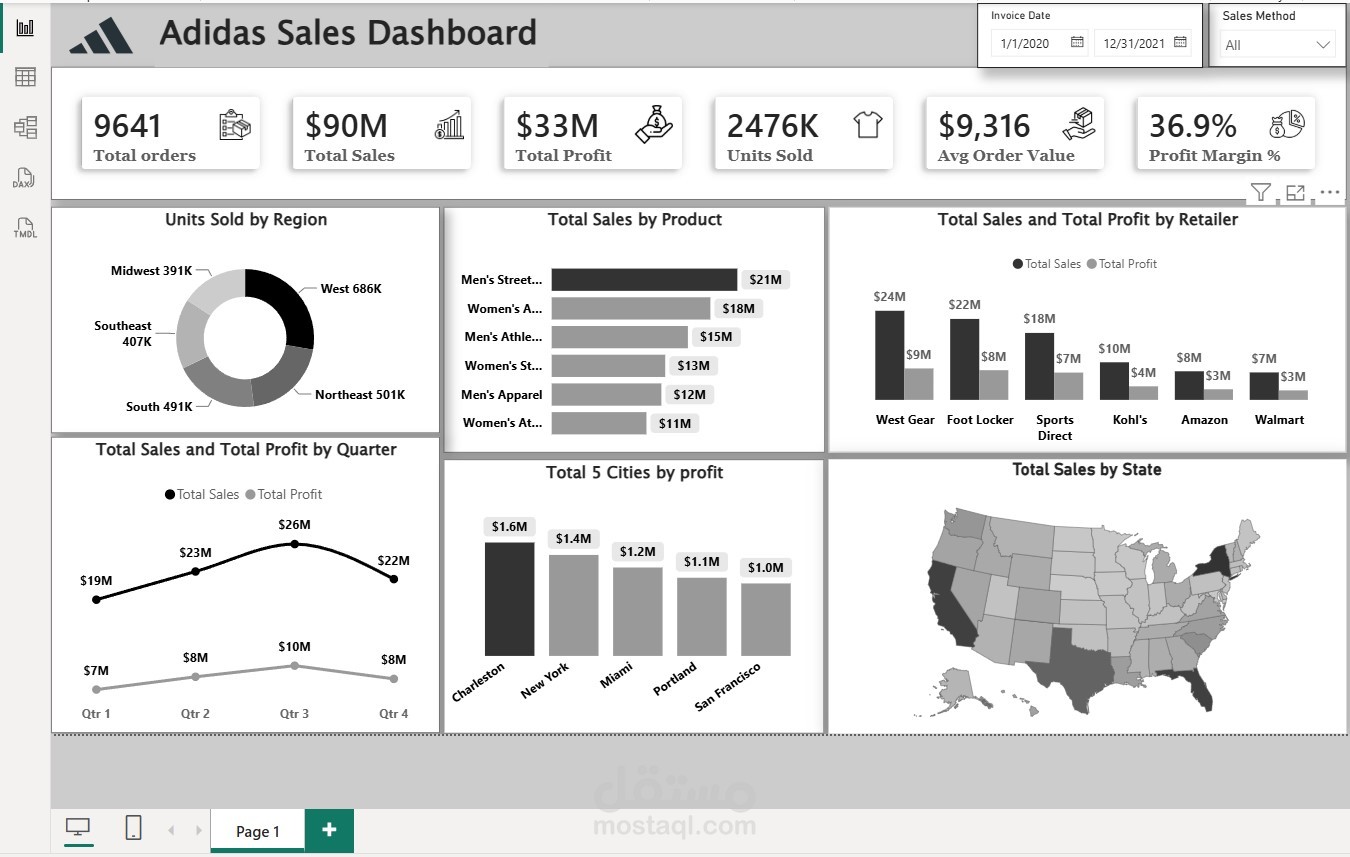
Developed an interactive Adidas Sales Dashboard using Power BI to analyze sales performance, profitability, and business trends.
Created KPI cards for Total Orders, Total Sales, Total Profit, Total Units, Average Order Value, and Profit Margin.
Analyzed sales by product, region, retailer, month, city, and state.
Created interactive charts including bar charts, donut charts, line charts, and maps.
Highlighted the Top 5 Cities by Profit and compared sales and profit across major retailers.
Used filters for Invoice Date and Sales Method to enable dynamic analysis.
Designed a clear and user-friendly dashboard to help users understand sales performance and identify key business insights.