Executive Overview Dashboard
تفاصيل العمل
Project Description
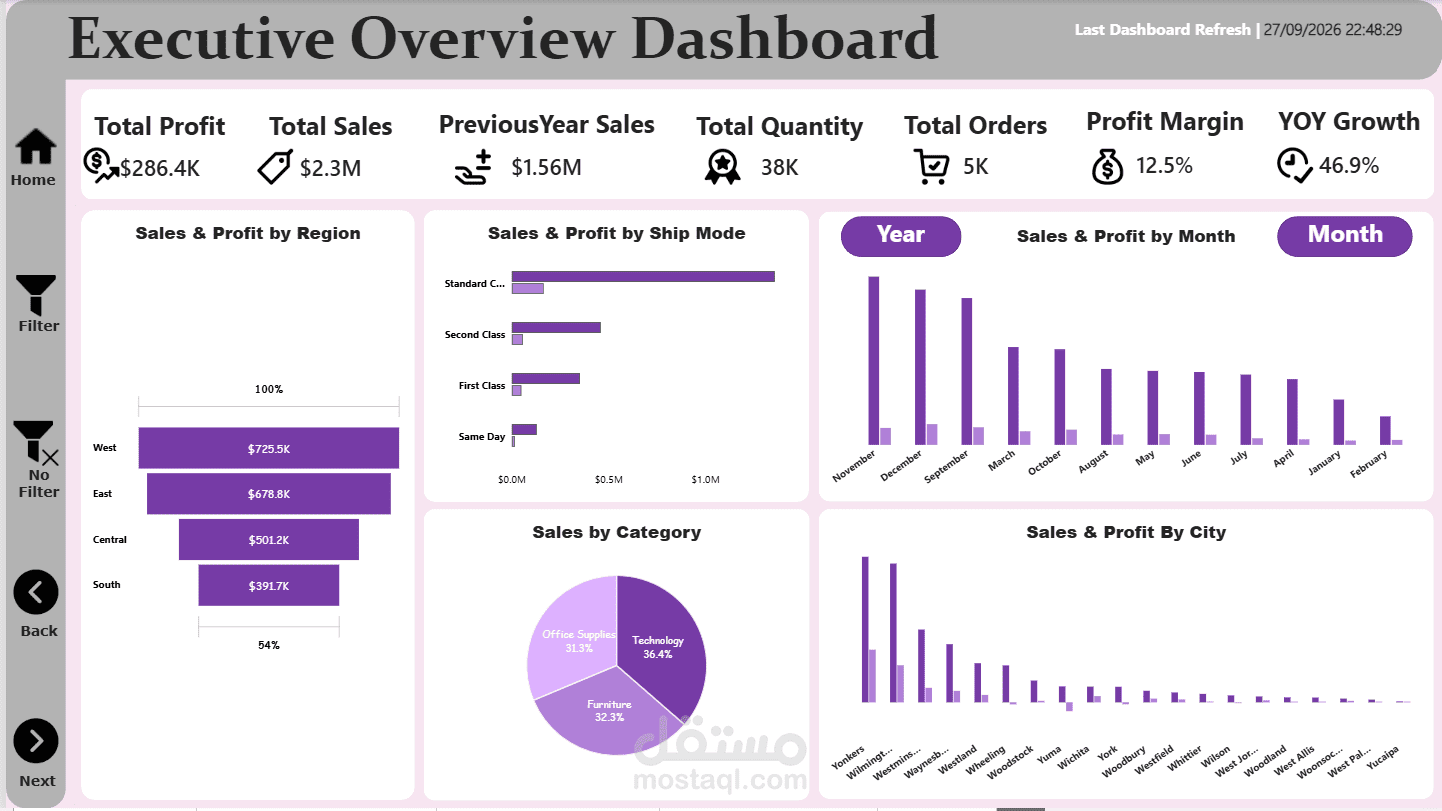
Developed an interactive Power BI Executive Dashboard to provide a clear overview of sales, profit, and business growth across regions, cities, categories, and shipping methods.
Key Features
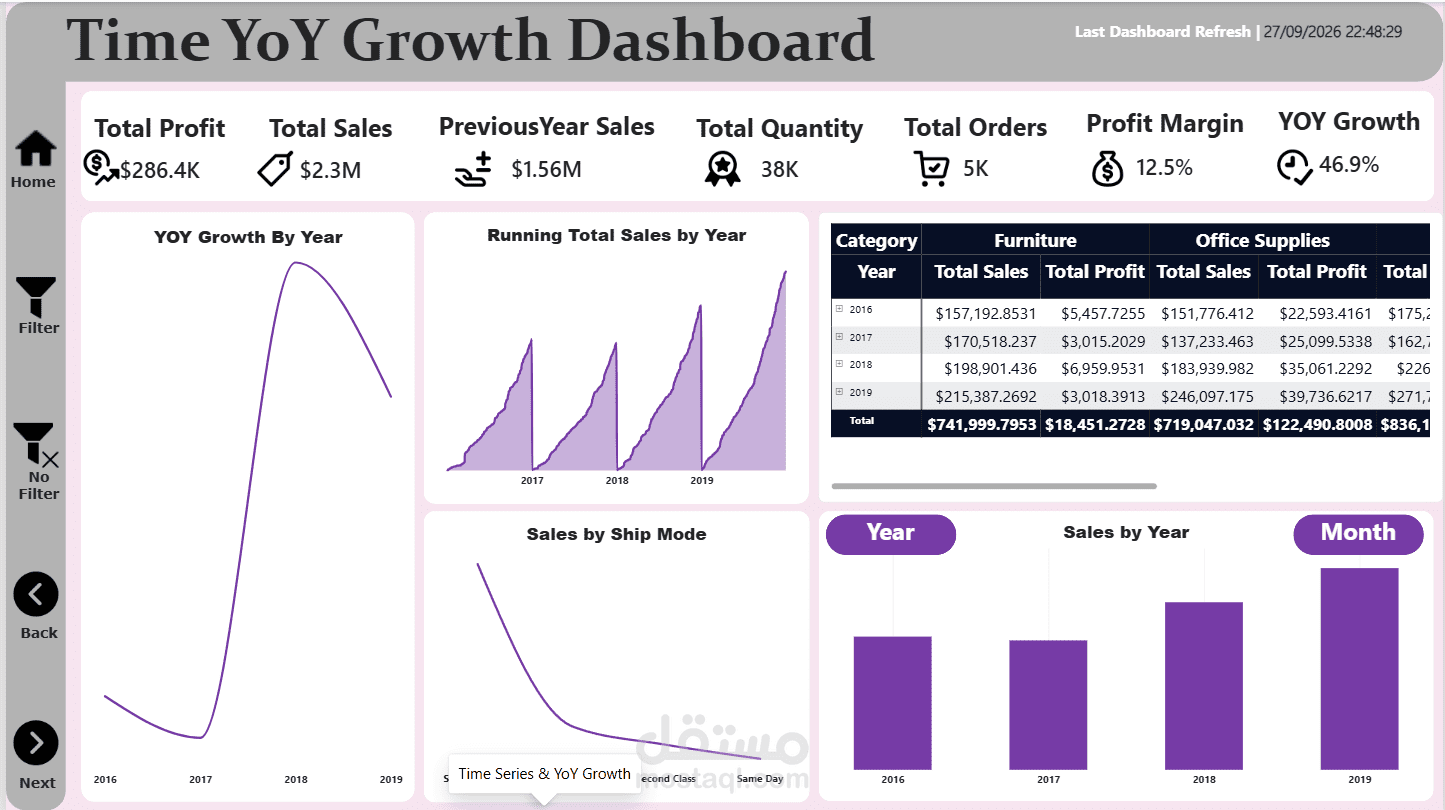
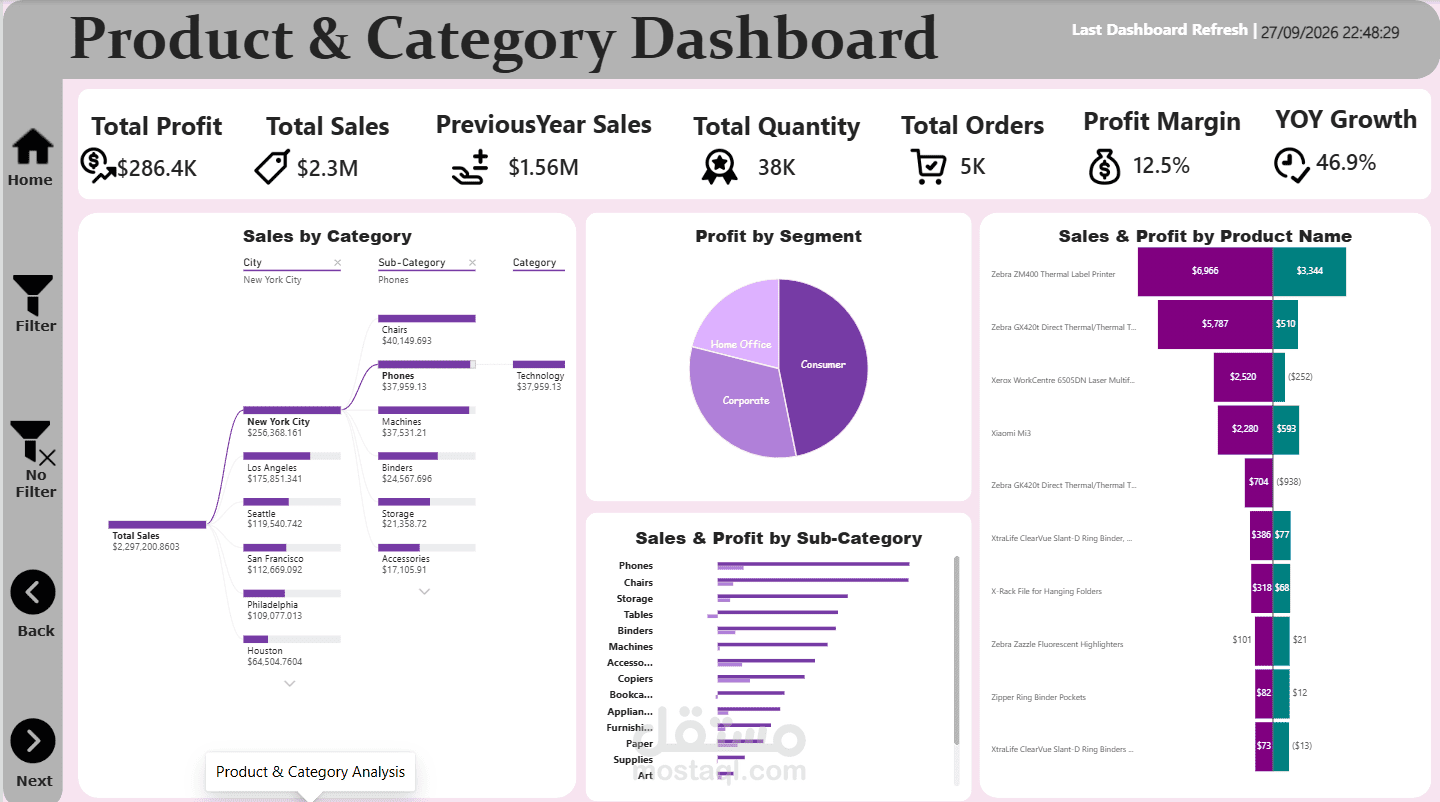
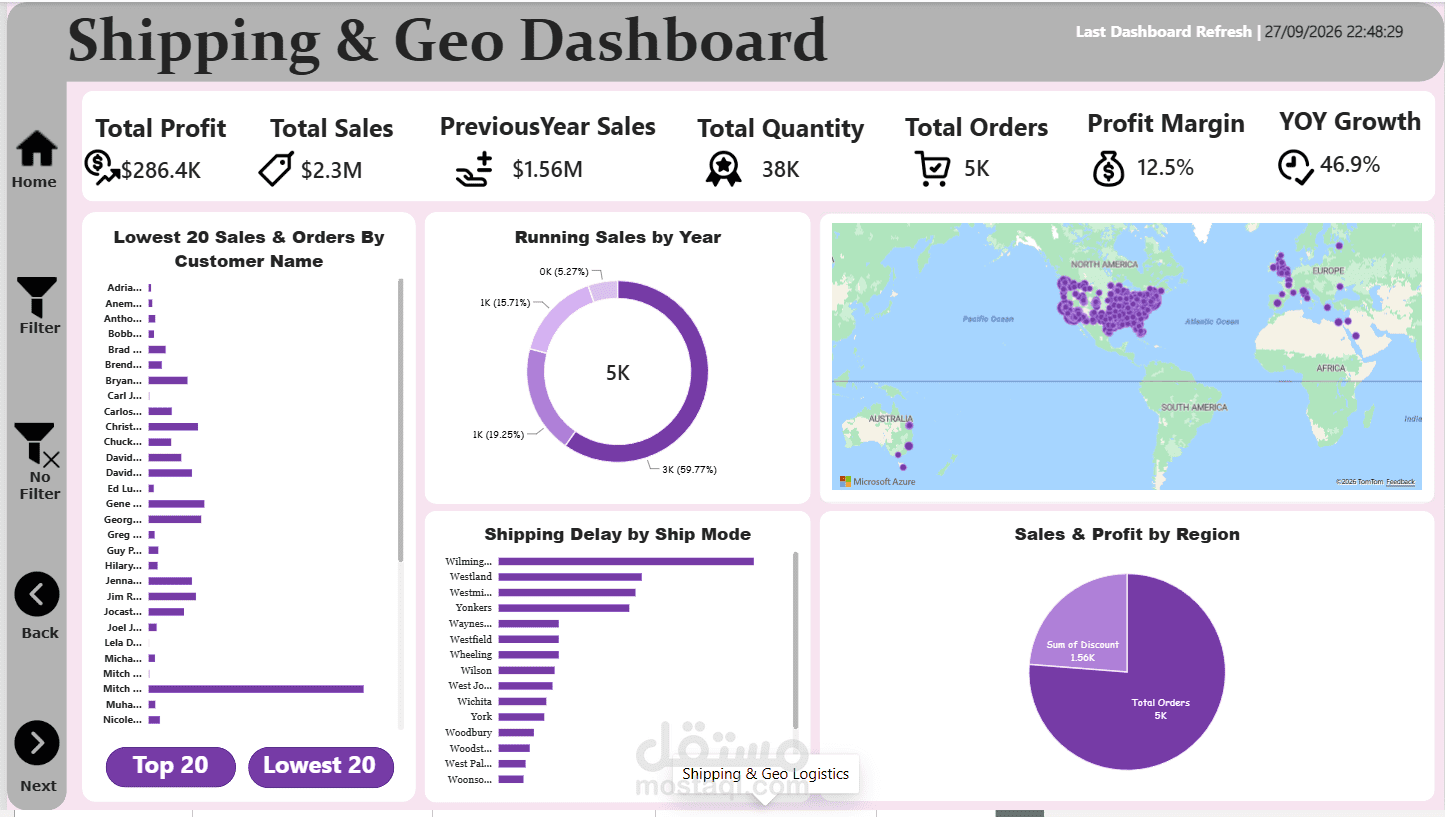
* KPI cards for Total Sales, Total Profit, Total Orders, Total Quantity, Profit Margin, Previous Year Sales, and YOY Growth.
* Sales and profit analysis by region, city, category, and shipping mode.
* Monthly and yearly performance analysis using interactive charts.
* Interactive filters and dynamic visual interactions.
* Page navigation using Power BI buttons.
* Year/Month toggle using Bookmarks.
Implementation
* Cleaned and transformed the data using Power Query.
* Created a Date Table for time-based analysis.
* Used DAX measures for Total Sales, Previous Year Sales, YOY Growth, and Profit Margin.
* Designed an interactive and user-friendly dashboard for executive-level reporting and data-driven decision-making.